- Splunk Answers
- :
- Using Splunk
- :
- Splunk Search
- :
- Re: eval lower command producing incorrect results
- Subscribe to RSS Feed
- Mark Topic as New
- Mark Topic as Read
- Float this Topic for Current User
- Bookmark Topic
- Subscribe to Topic
- Mute Topic
- Printer Friendly Page
- Mark as New
- Bookmark Message
- Subscribe to Message
- Mute Message
- Subscribe to RSS Feed
- Permalink
- Report Inappropriate Content
eval lower command producing incorrect results
I have a search that will basically look through some logs for a line "Inserting a record" and then take the username after this line and put it in a field called "inserting_a_record" for me. I also created a workflow action for these usernames where I can click the drop down menu next to a username and select a link from the drop down menu to look up this username in a mailing list application.
HOWEVER in the logs this username is displayed using capital letters. I used "eval" to tell splunk to display it in lower case letters because in the third party application where I look up there usernames, they are listed in lower case letters. Using capital letters yields no results so I had to make them lowercase.
Here is the search:
sourcetype="Cron_CheckRegistrarThreshold" NOT host="*.bmp2.*" source="*asia*" earliest=-1d@d latest=-0d@d | rex "registrar username: \[(?P<inserting_a_record>\S+)\]\s*Inserting a record" max_match=1000 | search inserting_a_record="*" | eval inserting_a_record=lower(inserting_a_record)
PROBLEM: For some reason this search only displays 4 user names for me in the field "inserting_a_record". However I know there are 30 usernames from looking at the log. If I take away the | eval inserting_a_record=lower(inserting_a_record), I then receive the 30 usernames in the results. The only problem is the usernames have uppercase letters and the workflow action wont' work.
An example of one of these usernames is 5427-TU. I use the eval command to make it display as 5427-tu.
I have this same exact search with another type of log and it works perfectly but with this one, i'm not really sure why it's calculating the wrong numbers.
Does anyone see anything obvious that sticks out?
- Mark as New
- Bookmark Message
- Subscribe to Message
- Mute Message
- Subscribe to RSS Feed
- Permalink
- Report Inappropriate Content
This search worked. I just added the table command and for some reason all the results are now displayed.
sourcetype="Cron_CheckRegistrarThreshold" NOT host=".bmp2." source="asia" earliest=-1d@d latest=-0d@d | rex "registrar username: [(?P<inserting_a_record>S+)]sInserting a record" max_match=1000 | search inserting_a_record="" | table "registrar username" inserting_a_record | eval inserting_a_record=lower(inserting_a_record)
However from doing this there are more results now...like empty lines or lines containing fields I don't want. This might not be the best solution but I'm experimenting with it.
- Mark as New
- Bookmark Message
- Subscribe to Message
- Mute Message
- Subscribe to RSS Feed
- Permalink
- Report Inappropriate Content
This finally worked...sourcetype="Cron_CheckRegistrarThreshold" NOT host=".bmp2." source="asia" earliest=-1d@d latest=-0d@d | rex "registrar username: [(?P
- Mark as New
- Bookmark Message
- Subscribe to Message
- Mute Message
- Subscribe to RSS Feed
- Permalink
- Report Inappropriate Content
I think that some (if not all) of these oddities you are experiencing are due to the fact that the log data coming in is formatted the way it is, e.g. there are no timestamps or similar to separate the events from each other.
It seems that splunk interprets all of your log events as single event. In my experience this makes the field extractions harder, since there will be multiple values for "username".
Somebody more skilled in multi-value stuff will have to take over from here.
Sorry,
/K
- Mark as New
- Bookmark Message
- Subscribe to Message
- Mute Message
- Subscribe to RSS Feed
- Permalink
- Report Inappropriate Content
Here's an example of some of the text from the log.
Wed Nov  9 23:45:01 UTC 2011
Both DB handles are connected
Resetting threshold count back to zero for registrars that have made a payment since the last run.
Threshold check query succeeded.
registrar username: [9345-NF]
Registrar has zero or negative balance but has been warned, cease emailing.
registrar username: [9715-MG]
Registrar has zero or negative balance but has been warned, cease emailing.
registrar username: [9153-WT]
Registrar has zero or negative balance but has been warned, cease emailing.
registrar username: [9643-IW]
Inserting a record into the notification table
Updating the registrar low threshold notification count
registrar username: [9875-NI]
Inserting a record into the notification table
Updating the registrar low threshold notification count
registrar username: [9879-NS]
Inserting a record into the notification table
Updating the registrar low threshold notification count
registrar username: [9338-HY]
Registrar has zero or negative balance but has been warned, cease emailing.
registrar username: [9175-ND]
Inserting a record into the notification table
Updating the registrar low threshold notification count
All done!
- Mark as New
- Bookmark Message
- Subscribe to Message
- Mute Message
- Subscribe to RSS Feed
- Permalink
- Report Inappropriate Content
I'm actually looking here: http://splunk-base.splunk.com/answers/2537/breaking-multiline-events
the example above of some of the log is 1 event. It's grouping everything together in one event...which i think is the problem.
- Mark as New
- Bookmark Message
- Subscribe to Message
- Mute Message
- Subscribe to RSS Feed
- Permalink
- Report Inappropriate Content
could you please post a list of the events as they are indexed by splunk? E.g.
Event #1
registrar username: [1111-AA]
inserting a record into some table
Event #2
registrar username: [2222-BB]
Updating something blah blah
- Mark as New
- Bookmark Message
- Subscribe to Message
- Mute Message
- Subscribe to RSS Feed
- Permalink
- Report Inappropriate Content
It's several events, usually in a 24 hour period.
- Mark as New
- Bookmark Message
- Subscribe to Message
- Mute Message
- Subscribe to RSS Feed
- Permalink
- Report Inappropriate Content
Is this just one event? Or do you break this into several events (in that case, how/where)?
/k
- Mark as New
- Bookmark Message
- Subscribe to Message
- Mute Message
- Subscribe to RSS Feed
- Permalink
- Report Inappropriate Content
anyone have any idea? i just don't get why it's changing my answers.
- Mark as New
- Bookmark Message
- Subscribe to Message
- Mute Message
- Subscribe to RSS Feed
- Permalink
- Report Inappropriate Content
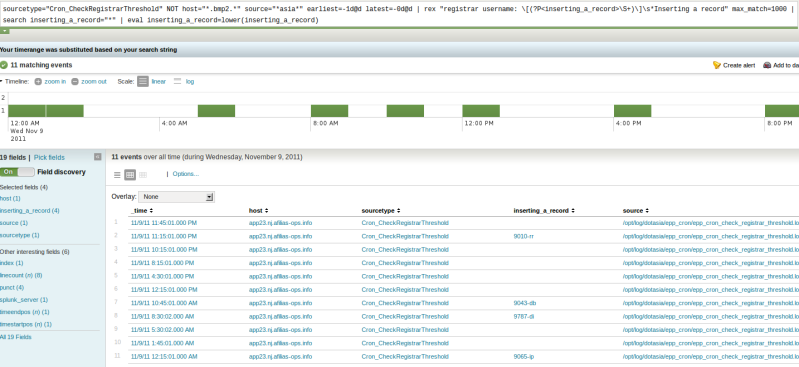
Ok the first photo is the search using the eval command. You can see from the field "inserting_a_record_" that there is only about 4 results.
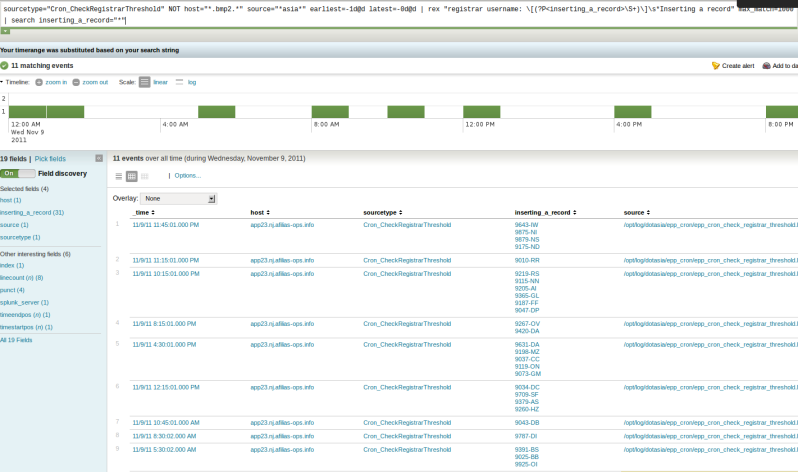
The second photo is when I removed the eval command and the results for "inserting_a_record" were correct. There were in total 30 results for "inserting_a_record".
I also tried removing the "max_match=1000" but this only produced about 15 results, which is only half.
- Mark as New
- Bookmark Message
- Subscribe to Message
- Mute Message
- Subscribe to RSS Feed
- Permalink
- Report Inappropriate Content
oh sorry about that
- Mark as New
- Bookmark Message
- Subscribe to Message
- Mute Message
- Subscribe to RSS Feed
- Permalink
- Report Inappropriate Content
Just an FYI, you can always edit/revise your original question. That is usually preferable to appending answers that provide additional information.
- Mark as New
- Bookmark Message
- Subscribe to Message
- Mute Message
- Subscribe to RSS Feed
- Permalink
- Report Inappropriate Content
There are several places that you're restricting your results. earliest/latest and max_match. Verify that the data you're expecting is in that time and number of records range. Better yet, post a sample of the data.
Introducing the Splunk Community Dashboard Challenge!
Get the T-shirt to Prove You Survived Splunk University Bootcamp
Wondering How to Build Resiliency in the Cloud?
