- Splunk Answers
- :
- Using Splunk
- :
- Splunk Search
- :
- Re: Unable to get value on x-axis
- Subscribe to RSS Feed
- Mark Topic as New
- Mark Topic as Read
- Float this Topic for Current User
- Bookmark Topic
- Subscribe to Topic
- Mute Topic
- Printer Friendly Page
- Mark as New
- Bookmark Message
- Subscribe to Message
- Mute Message
- Subscribe to RSS Feed
- Permalink
- Report Inappropriate Content
Unable to get value on x-axis
I have a tabular data like below.
**EventTime SQL CPU Utilization Other Process CPU Utilization   Total CPU Utilization**
2019-02-24 10:00:48.0   0   3   3
2019-02-24 10:01:48.0   0   2   2
2019-02-24 10:02:48.0   0   1   1
2019-02-24 10:03:48.0   0   1   1
2019-02-24 10:04:48.0   0   2   2
2019-02-24 10:05:48.0   0   2   2
2019-02-24 10:06:48.0   0   2   2
2019-02-24 10:07:48.0   0   3   3
2019-02-24 10:08:48.0   0   5   5
2019-02-24 10:09:48.0   0   3   3
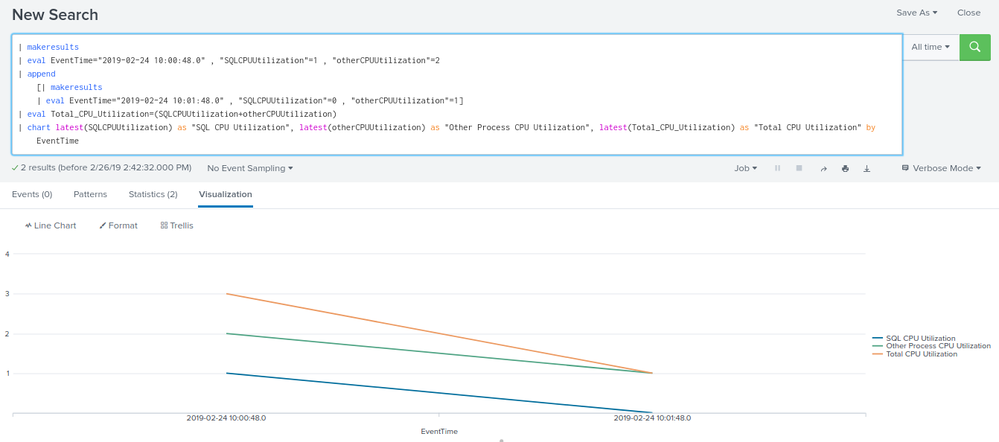
i tried to use the line chart and print EventTime on X-axis and rest values on Y-axis. I am able to get the values on Y-axis but X-axis not displaying the data of EventTime field. I used below query.
index=main sourcettype="SQL" host=ABC | eval Total_CPU_Utilization=(SQLCPUUtilization+OtherProcessCPUUtilization) | chart latest(SQLCPUUtilization) as "SQL CPU Utilization", latest(OtherProcessCPUUtilization) as "Other Process CPU Utilization", latest(Total_CPU_Utilization) as "Total CPU Utilization" by EventTime
Do I need to make any changes in my query?
- Mark as New
- Bookmark Message
- Subscribe to Message
- Mute Message
- Subscribe to RSS Feed
- Permalink
- Report Inappropriate Content
Like this (the key is to convert EventTime to _time😞
|makeresults | eval raw="EventTime=2019-02-24T10:00:48.0,SQL_CPU_Utilization=0,Other_Process_CPU_Utilization=3,Total_CPU_Utilization=3 EventTime=2019-02-24T10:01:48.0,SQL_CPU_Utilization=0,Other_Process_CPU_Utilization=2,Total_CPU_Utilization=2 EventTime=2019-02-24T10:02:48.0,SQL_CPU_Utilization=0,Other_Process_CPU_Utilization=1,Total_CPU_Utilization=1 EventTime=2019-02-24T10:03:48.0,SQL_CPU_Utilization=0,Other_Process_CPU_Utilization=1,Total_CPU_Utilization=1 EventTime=2019-02-24T10:04:48.0,SQL_CPU_Utilization=0,Other_Process_CPU_Utilization=2,Total_CPU_Utilization=2 EventTime=2019-02-24T10:05:48.0,SQL_CPU_Utilization=0,Other_Process_CPU_Utilization=2,Total_CPU_Utilization=2 EventTime=2019-02-24T10:06:48.0,SQL_CPU_Utilization=0,Other_Process_CPU_Utilization=2,Total_CPU_Utilization=2 EventTime=2019-02-24T10:07:48.0,SQL_CPU_Utilization=0,Other_Process_CPU_Utilization=3,Total_CPU_Utilization=3 EventTime=2019-02-24T10:08:48.0,SQL_CPU_Utilization=0,Other_Process_CPU_Utilization=5,Total_CPU_Utilization=5 EventTime=2019-02-24T10:09:48.0,SQL_CPU_Utilization=0,Other_Process_CPU_Utilization=3,Total_CPU_Utilization=3"
| makemv raw
| mvexpand raw
| rename raw AS _raw
| rex mode=sed "s/T(\d)/ \1/"
| kv

| rename COMMENT AS "Everything above generates sample event data; everything below is your solution"

| eval _time = strptime(EventTime, "%Y-%m-%d %H:%M:%S")
| fields - EventTime
| timechart fixedrange=f span=1m avg(*) AS *
- Mark as New
- Bookmark Message
- Subscribe to Message
- Mute Message
- Subscribe to RSS Feed
- Permalink
- Report Inappropriate Content
- Mark as New
- Bookmark Message
- Subscribe to Message
- Mute Message
- Subscribe to RSS Feed
- Permalink
- Report Inappropriate Content
@ashajambagi ,
My query is working fine. But when I switch to visualization tab I am unable to see EventTime field value on X-axis. I am currently using Splunk 7.1.6 .
- Mark as New
- Bookmark Message
- Subscribe to Message
- Mute Message
- Subscribe to RSS Feed
- Permalink
- Report Inappropriate Content
Can you share a screenshot?
- Mark as New
- Bookmark Message
- Subscribe to Message
- Mute Message
- Subscribe to RSS Feed
- Permalink
- Report Inappropriate Content
I am unable to add image for this.
- Mark as New
- Bookmark Message
- Subscribe to Message
- Mute Message
- Subscribe to RSS Feed
- Permalink
- Report Inappropriate Content
try putting it as answer
- Mark as New
- Bookmark Message
- Subscribe to Message
- Mute Message
- Subscribe to RSS Feed
- Permalink
- Report Inappropriate Content
Hi dyude @twh1 ,
Check the field name of EventTime and copy as it is.
Can you try this,
index=main sourcettype="SQL" host=ABC | eval Total_CPU_Utilization=("SQL CPU Utilization"+"Other Process CPU Utilization")
|chart latest("SQL CPU Utilization") as "SQL CPU Utilization", latest("Other Process CPU Utilization") as "Other Process CPU Utilization", latest(Total_CPU_Utilization) as "Total CPU Utilization" by EventTime
- Mark as New
- Bookmark Message
- Subscribe to Message
- Mute Message
- Subscribe to RSS Feed
- Permalink
- Report Inappropriate Content
hi @vinod94 ,
I have copied the field name from event only. I am getting data in statistics tab properly. But while checking in visualization tab, not getting value on X-axis.

