- Splunk Answers
- :
- Using Splunk
- :
- Splunk Search
- :
- Re: Transaction grouping help
- Subscribe to RSS Feed
- Mark Topic as New
- Mark Topic as Read
- Float this Topic for Current User
- Bookmark Topic
- Subscribe to Topic
- Mute Topic
- Printer Friendly Page
- Mark as New
- Bookmark Message
- Subscribe to Message
- Mute Message
- Subscribe to RSS Feed
- Permalink
- Report Inappropriate Content
Transaction grouping help
Below is my net cool event logs sample:
IMPACTVERSION=8, LOG_ID=123456, LOG_DT=2017-09-21 21:45:11, STARTTIME=2017-09-21 20:43:15.0, SERVERNAME = 'SERVER1' AND SERVERSERIAL = 1234567, ENDTIME=2017-09-21 20:43:16.0, SEVERITY=3, CHANGETIME=2017-09-21 21:44:01.0, SUMMARY=“SERVER DOWN_SERVER1”, SERVER_SITE=32, REL_CORRELATIONTYPE=Source, SITE_CORRELATIONID=NULL, SITE_CORRELATIONTYPE=Source
IMPACTVERSION=8, LOG_ID=123456, LOG_DT=2017-09-21 21:46:52, STARTTIME=2017-09-21 20:44:25.0, SERVERNAME = 'SERVER1' AND SERVERSERIAL = 1234567, ENDTIME=2017-09-21 20:44:25.0, SEVERITY=3, CHANGETIME=2017-09-21 21:45:11.0, SUMMARY=“SERVER DOWN_SERVER1”, SERVER_SITE=32, REL_CORRELATIONTYPE=Source, SITE_CORRELATIONID=NULL, SITE_CORRELATIONTYPE=Source
IMPACTVERSION=8, LOG_ID=123456, LOG_DT=2017-09-21 21:45:11, STARTTIME=2017-09-22 02:41:25.0, SERVERNAME = 'SERVER1' AND SERVERSERIAL = 1234567, ENDTIME=2017-09-22 02:41:26.0, SEVERITY=0, CHANGETIME=2017-09-21 02:44:01.0, SUMMARY=“SERVER UP_SERVER1”, SERVER_SITE=32, REL_CORRELATIONTYPE=Source, SITE_CORRELATIONID=NULL, SITE_CORRELATIONTYPE=Source
IMPACTVERSION=8, LOG_ID=123456, LOG_DT=2017-09-21 21:45:11, STARTTIME=2017-09-22 02:43:15.0, SERVERNAME = 'SERVER1' AND SERVERSERIAL = 1234567, ENDTIME=2017-09-22 02:43:16.0, SEVERITY=0, CHANGETIME=2017-09-21 02:45:01.0, SUMMARY=“SERVER UP_SERVER1”, SERVER_SITE=32, REL_CORRELATIONTYPE=Source, SITE_CORRELATIONID=NULL, SITE_CORRELATIONTYPE=Source
When I use the transaction command as below
| transaction SERVERNAME startswith=(SUMMARY=“SERVER DOWN_”) endswith=(SUMMARY=“SERVER UP_”) keeporphans=true keepevicted=true maxspan=28d
I should get the time difference between the first(STARTTIME) and last(ENDTIME) as total “Server Down Time” .i.e time difference between 1st and 3rd log. But in my case I get the time difference between the 1st and 4th log. Below is the query I use.
basic search….. | transaction SERVERNAME,SERVER_SITE startswith=(SUMMARY=“SERVER DOWN_SERVER1”) endswith=(SUMMARY=“SERVER UP_SERVER1”) keeporphans=true keepevicted=true maxspan=28d
| search eventcount>1
| stats min(STARTTIME) as "Outage Start Time", max(ENDTIME) as "Outage End Time", sum(duration) as total_outage_seconds, count as total_outages by _time , SERVERNAME, SERVER_SITE
Any help would be appreciated.
- Mark as New
- Bookmark Message
- Subscribe to Message
- Mute Message
- Subscribe to RSS Feed
- Permalink
- Report Inappropriate Content
please try below,
| transaction SERVERNAME startswith=eval(match(SUMMARY,“SERVER DOWN_\w+”)) endswith=eval(match(SUMMARY,“SERVER UP_\w+”)) keepevicted=true maxspan=28d | eval StartTime=_time | eval EndTime=_time+duration | eval "Session Length"=tostring(duration, "duration")| streamstats window=1 current=f last(StartTime) as next_starttime | eval delta=next_starttime-StartTime | eval "StartTime"= strftime(StartTime, "%m/%d/%y %H:%M:%S") | eval "EndTime"=strftime(EndTime, "%m/%d/%y %H:%M:%S")
I hope it helps
- Mark as New
- Bookmark Message
- Subscribe to Message
- Mute Message
- Subscribe to RSS Feed
- Permalink
- Report Inappropriate Content
START TIME END TIME SUMMARY
1 2016-10-12 16:11:17 2016-10-12 16:11:17 Interface Down: Gi0/0 -
2 2016-11-06 01:59:14 2016-11-06 01:59:14 Interface Down: Gi0/0 -
3 2016-11-06 01:59:14 2016-11-06 01:59:14 Interface Down: Gi0/0 -
4 2016-11-06 01:59:14 2016-11-06 01:59:14 Interface Down: Gi0/0 -
5 2016-11-06 01:59:14 2016-11-06 01:59:14 Interface Down: Gi0/0 -
6 2016-11-06 01:59:14 2016-11-06 01:59:14 Interface Down: Gi0/0 -
7 2016-11-06 01:59:14 2016-11-06 01:59:14 Interface Down: Gi0/0 -
8 2016-11-06 02:00:01 2016-11-06 02:00:01 Interface Up: Gi0/0 -
9 2016-11-06 02:00:01 2016-11-06 02:00:01 Interface Up: Gi0/0 -
10 2016-11-08 00:56:09 2016-11-08 00:56:09 Interface Down: Gi0/0 -
11 2016-11-08 00:56:09 2016-11-08 00:56:09 Interface Down: Gi0/0 -
12 2016-11-08 00:56:09 2016-11-08 00:56:09 Interface Down: Gi0/0 -
13 2016-11-08 00:56:09 2016-11-08 00:56:09 Interface Down: Gi0/0 -
14 2016-11-08 00:56:55 2016-11-08 00:56:55 Interface Up: Gi0/0 -
15 2016-11-08 00:56:55 2016-11-08 00:56:55 Interface Up: Gi0/0 -
16 2016-11-08 01:05:55 2016-11-08 01:05:55 Interface Up: Gi0/0 -
17 2016-11-08 01:05:55 2016-11-08 01:05:55 Interface Up: Gi0/0 -
I tried your query and it partially worked. Thnks
Here is exactly what is going wrong. So the actual downtime will be 2016-10-12 16:11:17 and the time it comes up is 2016-11-06 02:00:01. But my transaction is grouping with 2016-11-08 01:05:55 this event. So it takes line 1 - line17 to be my downtime hours.
- Mark as New
- Bookmark Message
- Subscribe to Message
- Mute Message
- Subscribe to RSS Feed
- Permalink
- Report Inappropriate Content
looks like the log timings are giving troubles on how the event "duration" gets calculated by the transaction.
i updated the log timings and it works fine.
i updated the log timings -
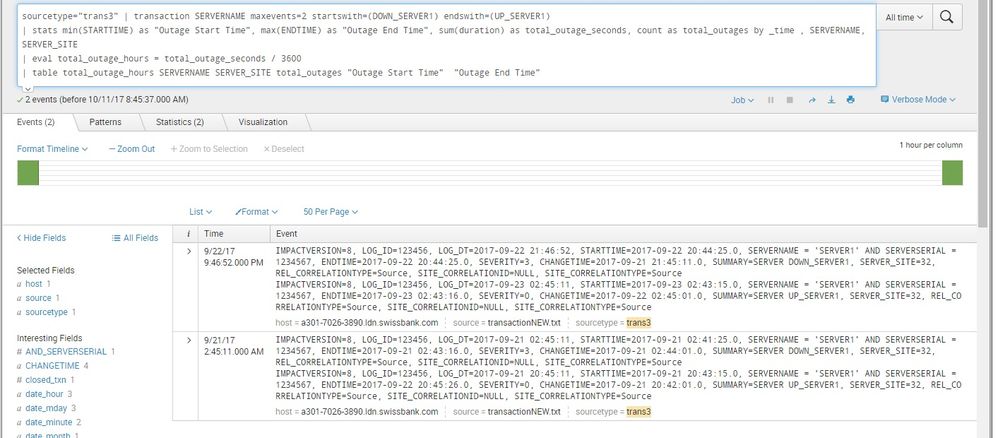
 IMPACTVERSION=8, LOG_ID=123456, LOG_DT=2017-09-21 02:45:11, STARTTIME=2017-09-21 02:41:25.0, SERVERNAME = 'SERVER1' AND SERVERSERIAL = 1234567, ENDTIME=2017-09-21 02:43:16.0, SEVERITY=3, CHANGETIME=2017-09-21 02:44:01.0, SUMMARY=SERVER DOWN_SERVER1, SERVER_SITE=32, REL_CORRELATIONTYPE=Source, SITE_CORRELATIONID=NULL, SITE_CORRELATIONTYPE=Source

 IMPACTVERSION=8, LOG_ID=123456, LOG_DT=2017-09-21 20:45:11, STARTTIME=2017-09-21 20:43:15.0, SERVERNAME = 'SERVER1' AND SERVERSERIAL = 1234567, ENDTIME=2017-09-22 20:45:26.0, SEVERITY=0, CHANGETIME=2017-09-21 20:42:01.0, SUMMARY=SERVER UP_SERVER1, SERVER_SITE=32, REL_CORRELATIONTYPE=Source, SITE_CORRELATIONID=NULL, SITE_CORRELATIONTYPE=Source


 IMPACTVERSION=8, LOG_ID=123456, LOG_DT=2017-09-22 21:46:52, STARTTIME=2017-09-22 20:44:25.0, SERVERNAME = 'SERVER1' AND SERVERSERIAL = 1234567, ENDTIME=2017-09-22 20:44:25.0, SEVERITY=3, CHANGETIME=2017-09-21 21:45:11.0, SUMMARY=SERVER DOWN_SERVER1, SERVER_SITE=32, REL_CORRELATIONTYPE=Source, SITE_CORRELATIONID=NULL, SITE_CORRELATIONTYPE=Source

 IMPACTVERSION=8, LOG_ID=123456, LOG_DT=2017-09-23 02:45:11, STARTTIME=2017-09-23 02:43:15.0, SERVERNAME = 'SERVER1' AND SERVERSERIAL = 1234567, ENDTIME=2017-09-23 02:43:16.0, SEVERITY=0, CHANGETIME=2017-09-22 02:45:01.0, SUMMARY=SERVER UP_SERVER1, SERVER_SITE=32, REL_CORRELATIONTYPE=Source, SITE_CORRELATIONID=NULL, SITE_CORRELATIONTYPE=Source
Also i am using maxevents=2, so that events are grouped together properly and downtime calculated correctly.
- Mark as New
- Bookmark Message
- Subscribe to Message
- Mute Message
- Subscribe to RSS Feed
- Permalink
- Report Inappropriate Content
I get your point, but my logs are not in consecutive terms. I have 5,6 even 10 continuous logs saying "SERVERDOWN" and then couple of logs saying "SERVERUP". So I cant use maxevents=2.


