- Splunk Answers
- :
- Using Splunk
- :
- Splunk Search
- :
- How to timechart results of stats or transaction?
- Subscribe to RSS Feed
- Mark Topic as New
- Mark Topic as Read
- Float this Topic for Current User
- Bookmark Topic
- Subscribe to Topic
- Mute Topic
- Printer Friendly Page
- Mark as New
- Bookmark Message
- Subscribe to Message
- Mute Message
- Subscribe to RSS Feed
- Permalink
- Report Inappropriate Content
I am trying to identify client IP addresses that recur across multiple days and then graph just those that meet a certain criteria (more than 4 days in my example below) over time. I have the search that identifies the IPs in question but now I am not sure how to graph just the results.
Both of these give me the same, correct results...
* | eval eventDate=strftime(_time,"%F") | stats dc(eventDate) as dailyVisit by clientIp | where dailyVisit>4 | sort -dailyVisit
OR
* | bin span=1d _time | transaction clientIp _time | stats count(_time) as dailyVisit by clientIp | where dailyVisit>4 | sort -dailyVisit

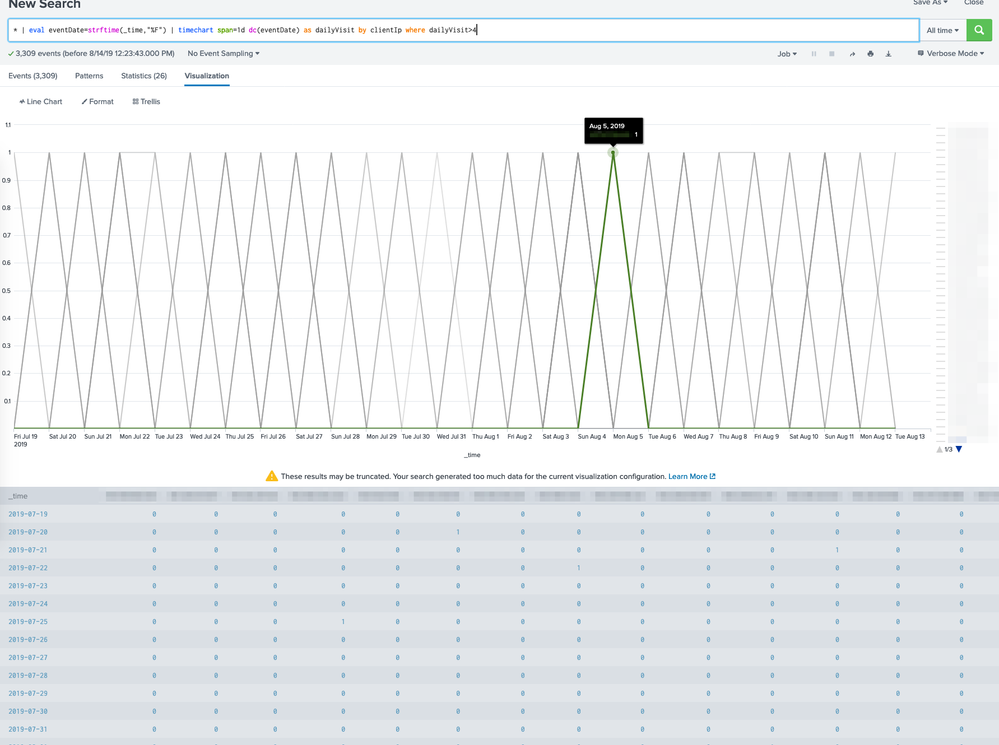
...but timechart won't run on them.
I have also tried to use just transaction and sort descending by count but it seems to list/graph them by random IP and not by number of transactions per IP
* | eval eventDate=strftime(_time,"%F") | transaction clientIp eventDate maxspan=1day | sort -count | timechart count by clientIp useother=false
Any idea on how to build a timechart of the events from just the IP addresses in either of the first two examples over time???
- Mark as New
- Bookmark Message
- Subscribe to Message
- Mute Message
- Subscribe to RSS Feed
- Permalink
- Report Inappropriate Content
Do not use map, do it with a subsearch like this:
... AND [ ... | eval eventDate=strftime(_time,"%F") | stats dc(eventDate) as dailyVisit BY clientIp | where dailyVisit>4 | table clientip ]
| timechart count by clientIp"
- Mark as New
- Bookmark Message
- Subscribe to Message
- Mute Message
- Subscribe to RSS Feed
- Permalink
- Report Inappropriate Content
OK, that worked and seems to be cleaner and certainly runs faster. Thank you!!
- Mark as New
- Bookmark Message
- Subscribe to Message
- Mute Message
- Subscribe to RSS Feed
- Permalink
- Report Inappropriate Content
So i finally figured it out...
TL;DR: I needed to use the map command to run each IP from my stats results through an entirely new search to get the timechart of all events for that IP.
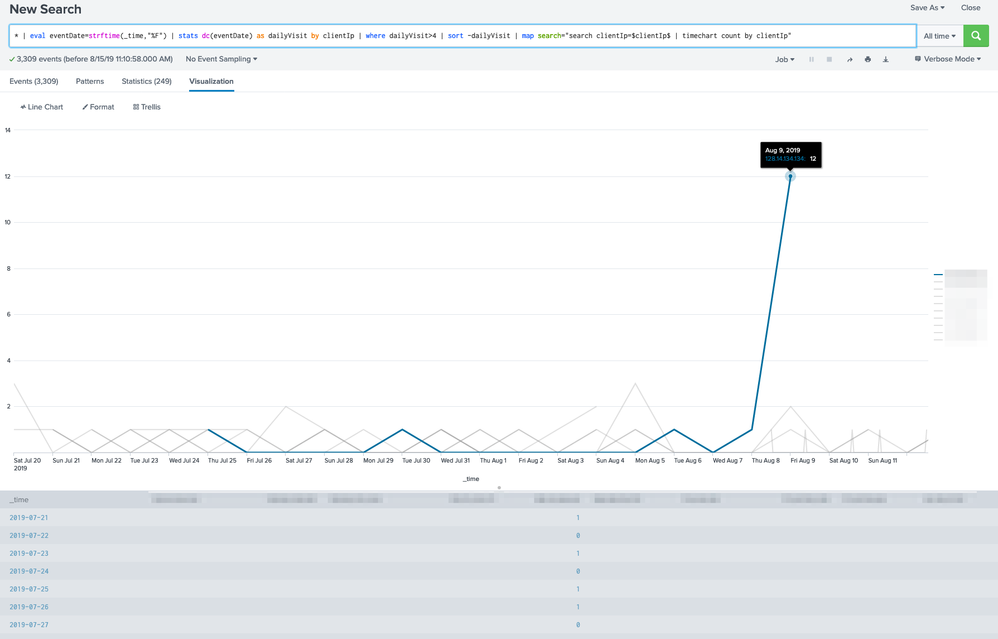
* | eval eventDate=strftime(_time,"%F") | stats dc(eventDate) as dailyVisit by clientIp | where dailyVisit>4 | sort -dailyVisit | map search="search clientIp=$clientIp$ | timechart count by clientIp"
Breaking this down for anyone who cares to learn from my noob-iness...
| eval eventDate=strftime(_time,"%F") or (from the original examples) | bin span=1d _time
I needed a way to group all requests from the same day from the same IP. Either of these will change the timestamp of the log events to a 1 day span. So rather than 7/27/19 08:53:19.253 AM the timestamp for each log will be just 7/27/19 or (in the case of the bin example) 7/27/19 12:00:00.000 AM. You can see this in the screenshots above.
| stats dc(eventDate) as dailyVisit by clientIp | where dailyVisit>4 | sort -dailyVisit
I now wanted to count how many diffrent days each IP has at least one log event.
| stats dc(eventDate) as dailyVisit by clientIp gives me a distinct count dc (saved as the variable dailyVisit) per clientIp.
| where dailyVisit>4 filters this to just the IP addresses that had more than 4 dailyVisits.
| sort -dailyVisit sorts it in descending order by number of dailyVisits.
At this point I had identified the clientIps in question but now I wanted to graph a timechart of ALL their log events but, the results of this search string did not have all their log data. In fact it only had two fields, clientIP and dailyVisit.
| map search="search clientIp=$clientIp$ | timechart count by clientIp"
So I needed the map (https://docs.splunk.com/Documentation/Splunk/7.3.0/SearchReference/Map) command to run each IP from the results of this search through an entirely new search to get a timechart of ALL of their log events.
Hope that helps someone some day!!
- Mark as New
- Bookmark Message
- Subscribe to Message
- Mute Message
- Subscribe to RSS Feed
- Permalink
- Report Inappropriate Content
Do not use map, do it with a subsearch like my new answer shows.
- Mark as New
- Bookmark Message
- Subscribe to Message
- Mute Message
- Subscribe to RSS Feed
- Permalink
- Report Inappropriate Content
you should try where clause with timechart
https://docs.splunk.com/Documentation/Splunk/latest/SearchReference/timechart#Where_clause_examples
.. | eval eventDate=strftime(_time,"%F") | timechart useother=f usenull=f span=1d dc(eventDate) by clientIp where dc > 3
- Mark as New
- Bookmark Message
- Subscribe to Message
- Mute Message
- Subscribe to RSS Feed
- Permalink
- Report Inappropriate Content
- Mark as New
- Bookmark Message
- Subscribe to Message
- Mute Message
- Subscribe to RSS Feed
- Permalink
- Report Inappropriate Content
oops I just modified my answer. It should be dc and not eventDate
- Mark as New
- Bookmark Message
- Subscribe to Message
- Mute Message
- Subscribe to RSS Feed
- Permalink
- Report Inappropriate Content
that didn't work either but I did figure it out. See my answer below.


