Turn on suggestions
Auto-suggest helps you quickly narrow down your search results by suggesting possible matches as you type.
Showing results for
Splunk Search
Turn on suggestions
Auto-suggest helps you quickly narrow down your search results by suggesting possible matches as you type.
Showing results for
- Splunk Answers
- :
- Using Splunk
- :
- Splunk Search
- :
- Re: Combinig two graphs into one
Options
- Subscribe to RSS Feed
- Mark Topic as New
- Mark Topic as Read
- Float this Topic for Current User
- Bookmark Topic
- Subscribe to Topic
- Mute Topic
- Printer Friendly Page
- Mark as New
- Bookmark Message
- Subscribe to Message
- Mute Message
- Subscribe to RSS Feed
- Permalink
- Report Inappropriate Content
matansocher
Contributor
03-29-2017
01:37 AM
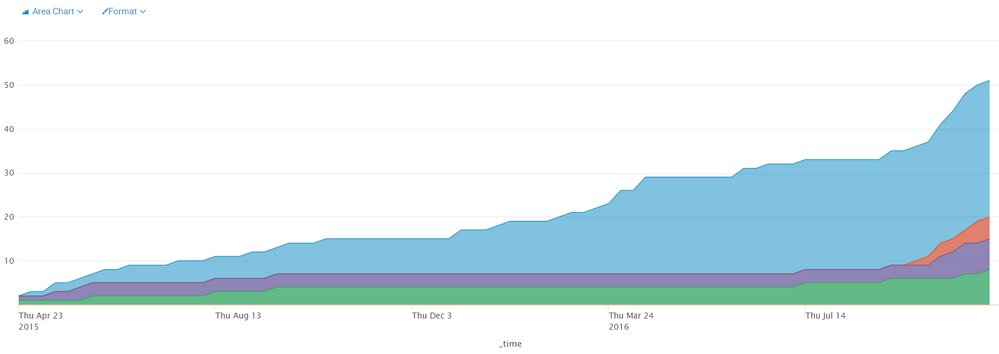
I have two graphs (I put example and their search code) and I want to display them on a single graph.
Is there a way to create that kind of graph?
1
| inputcsv MPSMilstonesCSV
| dedup Report_Milestone
| eval Report_Milestone1 = if((substr(Report_Milestone, 1, 1)  == "S"), substr(Report_Milestone, (len(Report_Milestone)-6), len(Report_Milestone)), Report_Milestone)
| fieldformat TaskDeadline = strftime(TaskDeadline, "%d/%m/%Y")
| streamstats count as milestoneNumber
| eval legend = milestoneNumber+" = "+Report_Milestone1
| table TaskDeadline Report_Milestone1 milestoneNumber legend
| chart sum(milestoneNumber) over TaskDeadline by legend
2
index=clearquest ("Project Name"=ipa_4*)
    ("Task Type"="Enhancement A*" OR "Task Type"=Defe* OR "Task Type"=Doc*)
    "Resolution"=* ("Severity"=*) "Task ID"=*
| dedup "Task ID"
| reverse
| timechart span=1w dc("Task ID") AS sum_of_tasks_per_week by Severity
| accum "S0-Critical"
| accum "S1-High Impact"
| accum "S2-Medium Impact"
| accum "S3-Low Impact"
| accum "S4-Unknown"
| accum "No Value"
Thank you
1 Solution
- Mark as New
- Bookmark Message
- Subscribe to Message
- Mute Message
- Subscribe to RSS Feed
- Permalink
- Report Inappropriate Content
somesoni2
Revered Legend
03-29-2017
11:32 PM
Give this a try. In dashboard panel visualization edit, add the fields from lookup (or from index) as overlay fields.
index=clearquest ("Project Name"=ipa_4*)
     ("Task Type"="Enhancement A*" OR "Task Type"=Defe* OR "Task Type"=Doc*)
     "Resolution"=* ("Severity"=*) "Task ID"=*
 | dedup "Task ID"
 | reverse
 | timechart span=1w dc("Task ID") AS sum_of_tasks_per_week by Severity
 | accum "S0-Critical"
 | accum "S1-High Impact"
 | accum "S2-Medium Impact"
 | accum "S3-Low Impact"
 | accum "S4-Unknown"
 | accum "No Value"
| append [| inputcsv MPSMilstonesCSV
 | dedup Report_Milestone
 | eval Report_Milestone1 = if((substr(Report_Milestone, 1, 1)  == "S"), substr(Report_Milestone, (len(Report_Milestone)-6), len(Report_Milestone)), Report_Milestone)
 | eval _time= TaskDeadline
 | streamstats count as milestoneNumber
 | eval legend = milestoneNumber+" = "+Report_Milestone1
 | chart sum(milestoneNumber) over _timeby legend]
| timechart values(*) as *
- Mark as New
- Bookmark Message
- Subscribe to Message
- Mute Message
- Subscribe to RSS Feed
- Permalink
- Report Inappropriate Content
matansocher
Contributor
04-04-2017
12:11 AM
the answer did not give me the exact result I wanted, but it gave me a direction of how I need to cimbine the 2 queries into 1.
thank you
- Mark as New
- Bookmark Message
- Subscribe to Message
- Mute Message
- Subscribe to RSS Feed
- Permalink
- Report Inappropriate Content
woodcock
Esteemed Legend
03-29-2017
12:23 PM
Your desire is to overlay the graphs semi-transparently as-is to merge the images, right?
- Mark as New
- Bookmark Message
- Subscribe to Message
- Mute Message
- Subscribe to RSS Feed
- Permalink
- Report Inappropriate Content
matansocher
Contributor
03-29-2017
11:17 PM
Yes, exactly.
Get Updates on the Splunk Community!
More Ways To Control Your Costs With Archived Metrics | Register for Tech Talk
Tuesday, May 14, 2024 | 11AM PT / 2PM ET
Register to Attend
Join us for this Tech Talk and learn how to ...
.conf24 | Personalize your .conf experience with Learning Paths!
Personalize your .conf24 Experience
Learning paths allow you to level up your skill sets and dive deeper ...
Threat Hunting Unlocked: How to Uplevel Your Threat Hunting With the PEAK Framework ...
WATCH NOWAs AI starts tackling low level alerts, it's more critical than ever to uplevel your threat hunting ...


