- Splunk Answers
- :
- Using Splunk
- :
- Splunk Search
- :
- how to get the event time and _time difference in ...
- Subscribe to RSS Feed
- Mark Topic as New
- Mark Topic as Read
- Float this Topic for Current User
- Bookmark Topic
- Subscribe to Topic
- Mute Topic
- Printer Friendly Page
- Mark as New
- Bookmark Message
- Subscribe to Message
- Mute Message
- Subscribe to RSS Feed
- Permalink
- Report Inappropriate Content
how to get the event time and _time difference in alert triggering time delay
how to show the how long alert took triggered from the time the event occurred.
To calculate the "diff" in times, to subtract either (_time - event_time) or, if event_time is null, (_time - orig_time), and then calculate the average time it took for each rule to fire, over time.
i have tried to calculate the diff but event_time and orig_time is present in same event and some doest have. Please help me to identify the difference in event time and alert triggering time delay.
index=notable
| eval diff = _time - event_time
| convert ctime(diff), ctime(orig_time)
| table event_time orig_time _time diff search_name
- Mark as New
- Bookmark Message
- Subscribe to Message
- Mute Message
- Subscribe to RSS Feed
- Permalink
- Report Inappropriate Content
Please don't duplicate threads. You already asked about the "lag" in another thread.
- Mark as New
- Bookmark Message
- Subscribe to Message
- Mute Message
- Subscribe to RSS Feed
- Permalink
- Report Inappropriate Content
Since it sounds like event_time is preferred over orig_time and it is possible for them to exist in the same event then I would suggest using a coalesce() function. The inputs in that function go from highest precedence on the leftmost side and each entry after is the next step lower precedence.
So the first non-null field from left to right is what will be used.
And to find avg diff over time for each rule can probably be done with a simple timechart.
I don't have access to ES or a notable index at the moment so I will just use fields described in your original question in the example.
Example:
index=notable
    | eval
        event_time_standardized=coalesce(event_time, orig_time),
        diff_seconds='_time'-'event_time_standardized',
        diff_minutes='diff_seconds'/60
    | timechart span=1h
        avg(diff_seconds) as avg_diff_in_seconds,
        avg(diff_minutes) as avg_diff_in_minutes
            by search_name
- Mark as New
- Bookmark Message
- Subscribe to Message
- Mute Message
- Subscribe to RSS Feed
- Permalink
- Report Inappropriate Content
- Mark as New
- Bookmark Message
- Subscribe to Message
- Mute Message
- Subscribe to RSS Feed
- Permalink
- Report Inappropriate Content
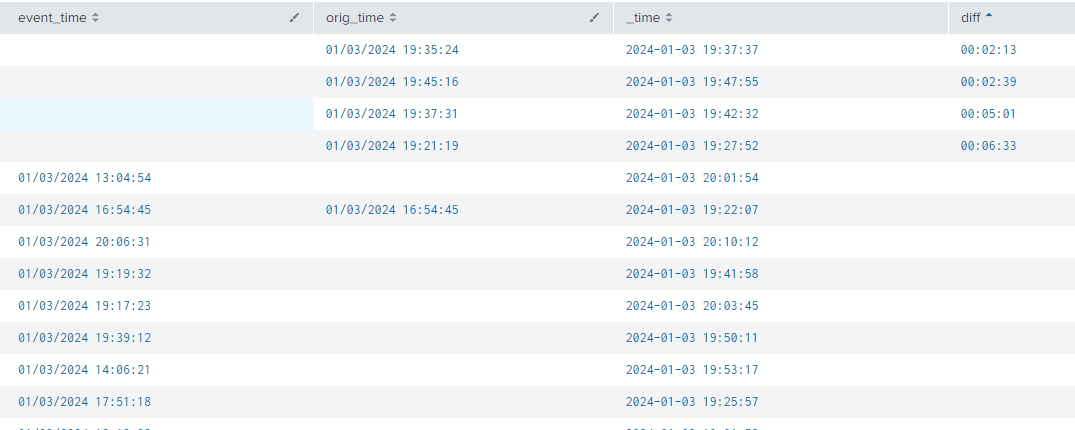
From the looks of the screenshot it appears that event_time probably isn't in epoch format so the diff isn't being properly evaluated.
How does it look when you try this?
index=notable
    | eval
        event_epoch=if(
            NOT isnum(event_time),
                strptime(event_time, "%m/%d/%Y %H:%M:%S"),
                'event_time'
            ),
        orig_epoch=if(
            NOT isnum(orig_time),
                strptime(orig_time, "%m/%d/%Y %H:%M:%S"),
                'orig_time'
            )
    | eval
        event_epoch_standardized=coalesce(event_epoch, orig_epoch),
        diff_seconds='_time'-'event_epoch_standardized',
        diff=tostring(diff_seconds, "duration")
    | table _time, search_name, event_time, diff
- Mark as New
- Bookmark Message
- Subscribe to Message
- Mute Message
- Subscribe to RSS Feed
- Permalink
- Report Inappropriate Content
Thank you for your kind response, I am getting 10 detections if there are10 rows in the result But the average time to detect should be an average of all the time differences from 1 alert mean time. Please find the attached screenshot for more information.
Splunk alert splunk_attack_1 triggered 2 times, i want to take the avg of time and display only one result with difference.
Sample result
| _time | search_name | event time | Hour at Source Mean Time to Detect | ||||||||
| 2/5/2024 | 19:47:10 | Splunk_Attack_1 | 2/5/2024 | 17:47:10 | 2 | Hr | 3 | Min | 19 | Secs.000000 | |
| 2/5/2024 | 19:20:10 | Splunk_Attack_1 | 2/5/2024 | 17:20:10 | 2 | Hr | 7 | Min | 18 | Secs.000000 | |
| 2/5/2024 | 19:30:35 | Splunk_Attack_2 | 2/5/2024 | 18:30:35 | 1 | Hr | 37 | Min | 12 | Secs.000000 | |
| 2/5/2024 | 18:20:15 | Splunk_Attack_2 | 2/5/2024 | 18:20:15 | 1 | Hr | 26 | Min | 15 | Secs.000000 | |
| 2/6/2024 | 18:05:15 | Splunk_Attack_2 | 2/6/2024 | 18:05:15 | 1 | Hr | 26 | Min | 15 | Secs.000000 | |
| 2/7/2024 | 16:55:15 | Splunk_Attack_3 | 2/7/2024 | 14:55:15 | 2 | Hr | 0 | Min | 18 | Secs.000000 | |
| 2/8/2024 | 16:35:15 | Splunk_Attack_3 | 2/8/2024 | 14:35:15 | 2 | Hr | 20 | Min | 18 | Secs.000000 | |
| 2/9/2024 | 16:10:15 | Splunk_Attack_3 | 2/9/2024 | 14:10:15 | 2 | Hr | 40 | Min | 18 | Secs.000000 |
Expected Result
| _time | search_name | event time | Hour at Source Mean Time to Detect | ||||||||
| 2/5/2024 | 19:47:10 | Splunk_Attack_1 | 2/5/2024 | 17:47:10 | 2 | Hr | 3 | Min | 19 | Secs.000000 | |
| 2/5/2024 | 19:20:10 | Splunk_Attack_2 | 2/5/2024 | 17:20:10 | 2 | Hr | 7 | Min | 18 | Secs.000000 | |
| 2/5/2024 | 19:30:35 | Splunk_Attack_3 | 2/5/2024 | 18:30:35 | 1 | Hr | 37 | Min | 12 | Secs.000000 |
- Mark as New
- Bookmark Message
- Subscribe to Message
- Mute Message
- Subscribe to RSS Feed
- Permalink
- Report Inappropriate Content
You would utilize the stats command to find an average of the diff_seconds field using a by-field of search_name.
Something like this (following the search I shared before)
index=notable
    | eval
        event_epoch=if(
            NOT isnum(event_time),
                strptime(event_time, "%m/%d/%Y %H:%M:%S"),
                'event_time'
            ),
        orig_epoch=if(
            NOT isnum(orig_time),
                strptime(orig_time, "%m/%d/%Y %H:%M:%S"),
                'orig_time'
            )
    | eval
        event_epoch_standardized=coalesce(event_epoch, orig_epoch),
        diff_seconds='_time'-'event_epoch_standardized'
    | fields + _time, search_name, event_time, diff_seconds
    | stats
        count as sample_size,
        min(diff_seconds) as min_diff_seconds,
        max(diff_seconds) as max_diff_seconds,
        avg(diff_seconds) as avg_diff_seconds
            by search_name
    | eval
        avg_diff=tostring(avg_diff_seconds, "duration")
Get Your Exclusive Splunk Certified Cybersecurity Defense Engineer at Splunk .conf24 ...
Share Your Ideas & Meet the Lantern team at .Conf! Plus All of This Month’s New ...
Combine Multiline Logs into a Single Event with SOCK: a Step-by-Step Guide for ...
