Turn on suggestions
Auto-suggest helps you quickly narrow down your search results by suggesting possible matches as you type.
Showing results for
Splunk Search
Turn on suggestions
Auto-suggest helps you quickly narrow down your search results by suggesting possible matches as you type.
Showing results for
- Splunk Answers
- :
- Using Splunk
- :
- Splunk Search
- :
- Show percentage on pie chart out of 100%
Options
- Subscribe to RSS Feed
- Mark Topic as New
- Mark Topic as Read
- Float this Topic for Current User
- Bookmark Topic
- Subscribe to Topic
- Mute Topic
- Printer Friendly Page
- Mark as New
- Bookmark Message
- Subscribe to Message
- Mute Message
- Subscribe to RSS Feed
- Permalink
- Report Inappropriate Content
Show percentage on pie chart out of 100%
trever
Loves-to-Learn
05-05-2020
01:02 PM
I have event logs with a % in them and I want to break them apart and show them on their own:
My event log looks like this:
Tue May  5 12:55:01 PDT 2020
/dev/sde2        9460988  7233068   1751044  81% /Volumes/Media 2
/dev/sdc1       13245631 12470714    107304 100% /Volumes/Media
Id like to turn it into this:
But with it showing the %'s as a total out of 100% (so 100% used and 81% used)
- Mark as New
- Bookmark Message
- Subscribe to Message
- Mute Message
- Subscribe to RSS Feed
- Permalink
- Report Inappropriate Content
to4kawa
Ultra Champion
05-05-2020
05:08 PM
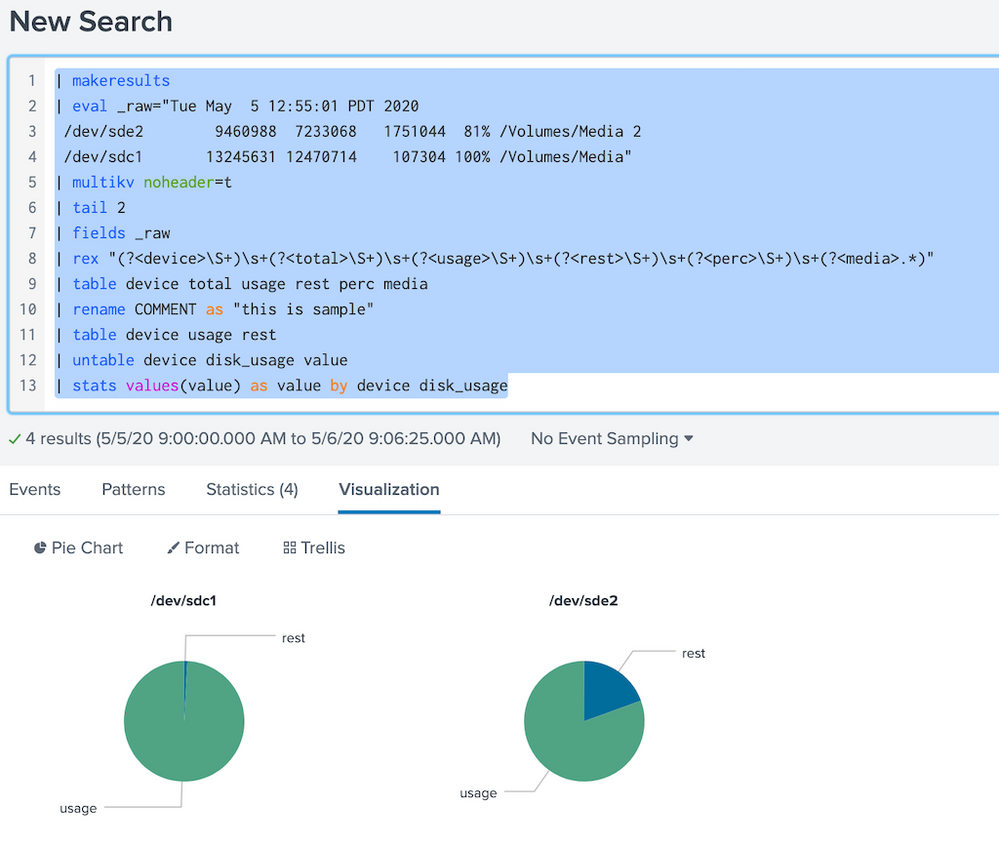
| makeresults
| eval _raw="Tue May  5 12:55:01 PDT 2020
 /dev/sde2        9460988  7233068   1751044  81% /Volumes/Media 2
 /dev/sdc1       13245631 12470714    107304 100% /Volumes/Media"
| multikv noheader=t
| tail 2
| fields _raw
| rex "(?<device>\S+)\s+(?<total>\S+)\s+(?<usage>\S+)\s+(?<rest>\S+)\s+(?<perc>\S+)\s+(?<media>.*)"
| table device total usage rest perc media
| rename COMMENT as "this is sample"
| table device usage rest
| untable device disk_usage value
| stats values(value) as value by device disk_usage
sorry, I can't display 100%
- Mark as New
- Bookmark Message
- Subscribe to Message
- Mute Message
- Subscribe to RSS Feed
- Permalink
- Report Inappropriate Content
tauliang
Communicator
05-05-2020
03:56 PM
Get Updates on the Splunk Community!
Stay Connected: Your Guide to May Tech Talks, Office Hours, and Webinars!
Take a look below to explore our upcoming Community Office Hours, Tech Talks, and Webinars this month. This ...
They're back! Join the SplunkTrust and MVP at .conf24
With our highly anticipated annual conference, .conf, comes the fez-wearers you can trust! The SplunkTrust, as ...
Enterprise Security Content Update (ESCU) | New Releases
Last month, the Splunk Threat Research Team had two releases of new security content via the Enterprise ...


