- Splunk Answers
- :
- Using Splunk
- :
- Splunk Search
- :
- How to graph the number of active sessions over ti...
- Subscribe to RSS Feed
- Mark Topic as New
- Mark Topic as Read
- Float this Topic for Current User
- Bookmark Topic
- Subscribe to Topic
- Mute Topic
- Printer Friendly Page
- Mark as New
- Bookmark Message
- Subscribe to Message
- Mute Message
- Subscribe to RSS Feed
- Permalink
- Report Inappropriate Content
The data that I would like to graph consists of start events and stop events. Sessions consist of one start event and one stop event, and both events have the same value for device_mac. Below is an example of my data and the transaction search used to group events into sessions:
Start event:
{"username": "blahblah", "device_mac": "12:32:23:23:12:12", "timestamp": 1445347547, "type": "Start", "input_octets": 11221086, "termination_cause": "Resumed", "input_gigawords": 0}
Stop event:
{"username": "blahblah", "device_mac":"12:32:23:23:12:12", "timestamp": 1445347761, "type": "Stop", "input_octets": 11221086, "termination_cause": "Idle-Timeout", "input_gigawords": 0}
Transaction search:
index="myindex" type="Start" OR (type="Stop" termination_cause=*) | transaction device_mac_address startswith="*\"type\": \"Start\"*" maxevents=2
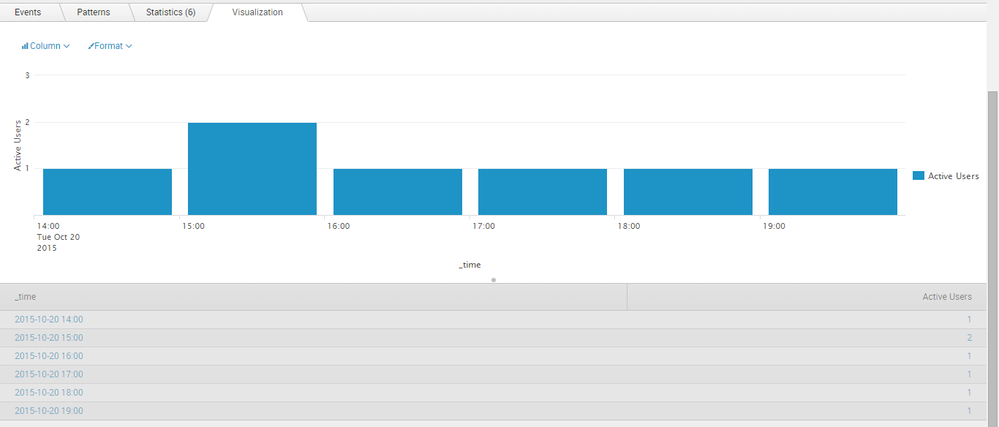
The transaction search would group the above two events together into a session. What I would now like to do is to create a graph of the number of active session over time. So if a session starts at 3pm and finishes at 7:45pm and my graph has time buckets for each hour, this session should be counted as active between 3-4, 4-5, 5-6 and 7-8. If I have another session starting at 2:30pm and finishing at 3:30, the graph for number of active users should look like below:
Does anyone have any ideas on how to achieve this? Thanks!
- Mark as New
- Bookmark Message
- Subscribe to Message
- Mute Message
- Subscribe to RSS Feed
- Permalink
- Report Inappropriate Content
First of all, ditch transaction and try something like this using the concurrency command (you will have to manually adjust the dates for the gentimes command or figure out how to parameterize them):
index="myindex" type="Start" OR (type="Stop" termination_cause=*)
| reverse
| streamstats current=f count(eval(type="Stop")) AS SessionID by device_mac_address
| eventstats latest(_time) AS stopTime by SessionID device_mac_address
| search type="Start" | eval duration = stopTime - _time
| table _time duration | rename _time AS starttime
| append [|gentimes start=1/1/2015 end=12/31/2015 increment=1h | eval duration=60*60 | eval type=gentimes]
| concurrency start=starttime duration=duration
| where type=gentimes
| eval concurrency = concurrency - 1
| timechart span=1h max(concurrency) AS "Active Users"
- Mark as New
- Bookmark Message
- Subscribe to Message
- Mute Message
- Subscribe to RSS Feed
- Permalink
- Report Inappropriate Content
Thanks so much, I wouldn't have got that without your help! I made a couple of minor edits to incorporate sessions that had not yet stopped, and I took an hour away from each event so that it overlapped with the beginning of the hour when it started. Here is my final search for anyone else doing this type of query ...
 index="myindex" type="Start" OR (type="Stop" termination_cause=*)
| reverse
| streamstats current=f count(eval(type="Stop")) AS SessionID by device_mac
| eventstats latest(_time) AS stopTime by SessionID device_mac
| search type="Start"
| eval stopTime=if(timestamp==stopTime,now(),stopTime)
| eval starttime=_time-3600
| fields - _time
| eval duration=stopTime-starttime
| table starttime duration
| append [|gentimes start=10/21/2015:00:00:00 end=10/21/2015:10:00:00 increment=1h | eval duration=60*60 | eval type="gentimes"]
| concurrency start=starttime duration=duration
| where type="gentimes"
| eval concurrency=concurrency-1
| rename starttime AS _time
| timechart span=1h max(concurrency) AS "Active Users"

