- Splunk Answers
- :
- Using Splunk
- :
- Dashboards & Visualizations
- :
- How to create a column chart By time Today/Yesterd...
- Subscribe to RSS Feed
- Mark Topic as New
- Mark Topic as Read
- Float this Topic for Current User
- Bookmark Topic
- Subscribe to Topic
- Mute Topic
- Printer Friendly Page
- Mark as New
- Bookmark Message
- Subscribe to Message
- Mute Message
- Subscribe to RSS Feed
- Permalink
- Report Inappropriate Content
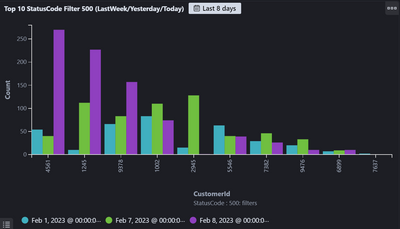
I want to see the 500 error count for each Customers over time (Today/Yesterday/LastWeekOfDay) So total 3 days.
Below screenshot is Kibana Chart. How can we create same kind of chart in Splunk?
I have tried below timechart query but x axis have time first instead of customerId.
index="services" statusCode="500" | timechart span=1d count by customerId
I have also tried with below Query But I feel Count in response in not correct.
index="services" statusCode="500" | bucket _time span=day | chart count by customerId,_time | head 10
Is there a better way to do it?
- Mark as New
- Bookmark Message
- Subscribe to Message
- Mute Message
- Subscribe to RSS Feed
- Permalink
- Report Inappropriate Content
If it is always the last / latest column, you could try something like this
| sort 0
    [| makeresults
    | addinfo
    | eval search=strftime(info_max_time-1, "%F")
    | fields search
| format "" "" "" "" "" ""]- Mark as New
- Bookmark Message
- Subscribe to Message
- Mute Message
- Subscribe to RSS Feed
- Permalink
- Report Inappropriate Content
Thanks @ITWhisperer , This Query is working for me. Now I'm facing a challenge to sort by specific column let say 3rd column.
index="services" statusCode="500" | bucket _time span=day | eval time=strftime(_time,"%F") | chart count by customerId
Since these date fields are dynamically getting generated and user can specify any date range So I can not specify | sort -"2023-02-09" .
In this case how to sort by any specific column which is dynamically generated by bucket _time span?
- Mark as New
- Bookmark Message
- Subscribe to Message
- Mute Message
- Subscribe to RSS Feed
- Permalink
- Report Inappropriate Content
The user can select the "up arrow" or "down arrow" next to the column name to sort the results by that column.
- Mark as New
- Bookmark Message
- Subscribe to Message
- Mute Message
- Subscribe to RSS Feed
- Permalink
- Report Inappropriate Content
@ITWhisperer , I want to do the sorting through Query as we need to use this chart in Dashboard.
I wonder if Splunk even have this feature.
- Mark as New
- Bookmark Message
- Subscribe to Message
- Mute Message
- Subscribe to RSS Feed
- Permalink
- Report Inappropriate Content
If it is always the last / latest column, you could try something like this
| sort 0
    [| makeresults
    | addinfo
    | eval search=strftime(info_max_time-1, "%F")
    | fields search
| format "" "" "" "" "" ""]- Mark as New
- Bookmark Message
- Subscribe to Message
- Mute Message
- Subscribe to RSS Feed
- Permalink
- Report Inappropriate Content
Your chart should work only _time will be in seconds, so I suggest you create a field with time formatted and use that field as the second dimension on the chart.
index="services" statusCode="500"
| bucket _time span=day
| eval time=strftime(_time,"%F")
| chart count by customerId, time
| head 10

