Turn on suggestions
Auto-suggest helps you quickly narrow down your search results by suggesting possible matches as you type.
Showing results for
Dashboards & Visualizations
Turn on suggestions
Auto-suggest helps you quickly narrow down your search results by suggesting possible matches as you type.
Showing results for
- Splunk Answers
- :
- Using Splunk
- :
- Dashboards & Visualizations
- :
- How to add % with a number value into the code
Options
- Subscribe to RSS Feed
- Mark Topic as New
- Mark Topic as Read
- Float this Topic for Current User
- Bookmark Topic
- Subscribe to Topic
- Mute Topic
- Printer Friendly Page
- Mark as New
- Bookmark Message
- Subscribe to Message
- Mute Message
- Subscribe to RSS Feed
- Permalink
- Report Inappropriate Content
How to add % with a number value into the code
sarithapguptha
Engager
07-13-2020
04:31 AM
Hi,
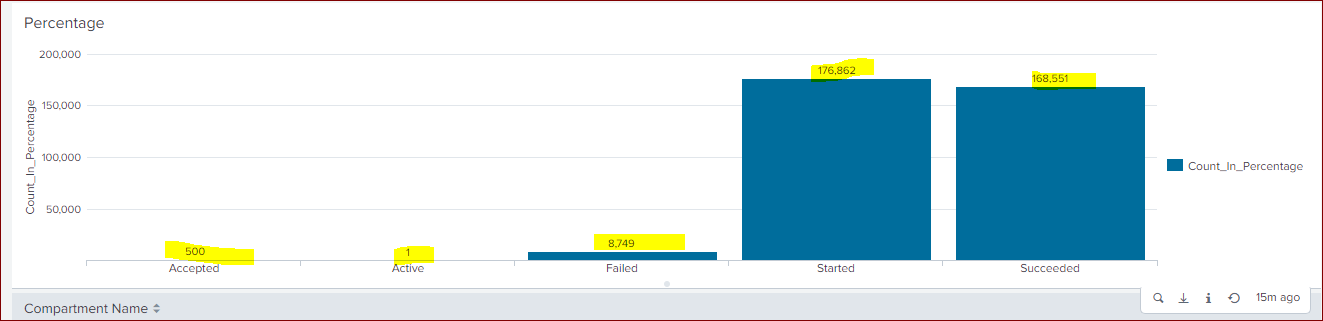
I want to show the % symbol along with the number values in the bar chart.
Attached chart only shows the number for each state as 500 1, etc, but I want to display it as 500%, 1% and 8749%
My code is -- index=* linecount=1 "status.value"=* | chart sum(linecount) as Count_In_Percentage by status.value
- Mark as New
- Bookmark Message
- Subscribe to Message
- Mute Message
- Subscribe to RSS Feed
- Permalink
- Report Inappropriate Content
niketn
Legend
07-13-2020
04:55 AM
@sarithapguptha refer to one of my older answers on similar lines: https://community.splunk.com/t5/Dashboards-Visualizations/Add-percent-sign-on-a-stacked-column-chart...
____________________________________________
| makeresults | eval message= "Happy Splunking!!!"
| makeresults | eval message= "Happy Splunking!!!"
Get Updates on the Splunk Community!
Built-in Service Level Objectives Management to Bridge the Gap Between Service & ...
Wednesday, May 29, 2024 | 11AM PST / 2PM ESTRegister now and join us to learn more about how you can ...
Get Your Exclusive Splunk Certified Cybersecurity Defense Engineer at Splunk .conf24 ...
We’re excited to announce a new Splunk certification exam being released at .conf24! If you’re headed to Vegas ...
Share Your Ideas & Meet the Lantern team at .Conf! Plus All of This Month’s New ...
Splunk Lantern is Splunk’s customer success center that provides advice from Splunk experts on valuable data ...
