Turn on suggestions
Auto-suggest helps you quickly narrow down your search results by suggesting possible matches as you type.
Showing results for
Dashboards & Visualizations
Turn on suggestions
Auto-suggest helps you quickly narrow down your search results by suggesting possible matches as you type.
Showing results for
- Splunk Answers
- :
- Using Splunk
- :
- Dashboards & Visualizations
- :
- Bar Chart Visualization
Options
- Subscribe to RSS Feed
- Mark Topic as New
- Mark Topic as Read
- Float this Topic for Current User
- Bookmark Topic
- Subscribe to Topic
- Mute Topic
- Printer Friendly Page
- Mark as New
- Bookmark Message
- Subscribe to Message
- Mute Message
- Subscribe to RSS Feed
- Permalink
- Report Inappropriate Content
intern_jos
Engager
01-17-2016
11:11 PM
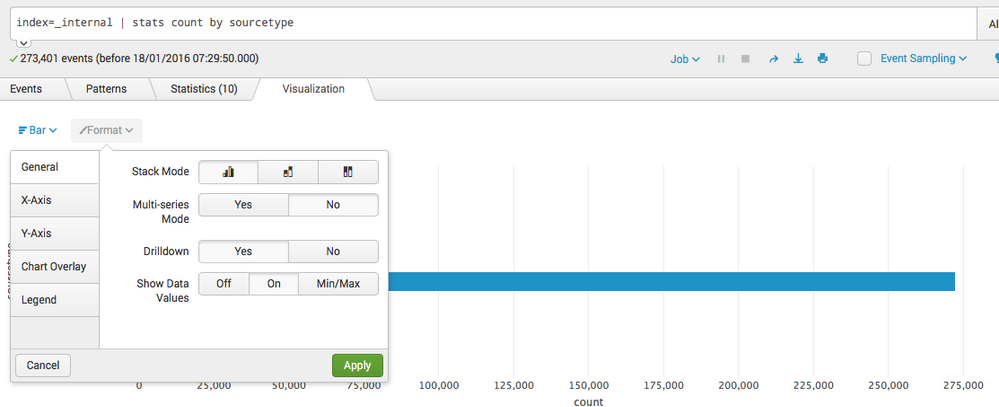
I would like to know if there is a way to display the total number of events at the top of the bar chart instead of using mouse over to see the exact number of events.
Thanks.
1 Solution
- Mark as New
- Bookmark Message
- Subscribe to Message
- Mute Message
- Subscribe to RSS Feed
- Permalink
- Report Inappropriate Content
MuS
Legend
01-17-2016
11:33 PM
Hi intern_jos,
Yes, you can enable this in the Visualization Format options:
and click on show data values. The result will be the values on the bars:
Hope this helps ...
cheers, MuS
- Mark as New
- Bookmark Message
- Subscribe to Message
- Mute Message
- Subscribe to RSS Feed
- Permalink
- Report Inappropriate Content
chimell
Motivator
01-18-2016
12:08 AM
Hi intern_jos
use these files if you work on splunk 6.2.x
1- xml code
<form script="custom_chart.js" stylesheet="custom_chart.css">
    <label>count by sourcetype</label>
   <fieldset autoRun="false" submitButton="false">

    <input type="time" token="tm" searchWhenChanged="true">
    <label>Select a time:</label>
    <default>All Time</default>
    </input>


  </fieldset>


  <row grouping="2">
        <html>
          <h2><strong>count by sourcetype</strong></h2>
            <div id="chart1" />
        </html>
        <table id="table1">
            <searchString>index=_internal |stats count by sourcetype</searchString>
            <earliestTime>$tm.earliest$</earliestTime>
            <latestTime>$tm.latest$</latestTime>
        </table>
    </row>


</form>
2- here is the js file
require([
    'underscore',
    'jquery',

    'splunkjs/mvc/utils',
    'splunkjs/mvc',
    'splunkjs/mvc/d3chart/d3chartview',
    'util/moment',
    'splunkjs/mvc/simplexml/ready!'
], function(_, $, utils, mvc, D3ChartView, moment) {

    // Re-use the search manager of the results table
    // var SearchManager = require("splunkjs/mvc/searchmanager");
     var tableManagerid1 = mvc.Components.get('table1').settings.get('managerid');
    // Create the D3 chart view
    var Barchart1 = new D3ChartView({
        "id": "chart1",
        "managerid": tableManagerid1,
        "type": "multiBarHorizontalChart",
        "drilldown": "full",
        "drilldownRedirect": false,
        "el": $('#chart1')
    }).render();

    Barchart1.settings.set("setup", function(chart) {
        // Configure chart formatting
        chart.color(d3.scale.category10().range())
        chart.showControls(true);
        chart.showValues(true); //Show bar value next to each bar.
        chart.tooltips(true);

    });

});
3- and the css file
#chart1
 {
    height: 450px;
}
- Mark as New
- Bookmark Message
- Subscribe to Message
- Mute Message
- Subscribe to RSS Feed
- Permalink
- Report Inappropriate Content
MuS
Legend
01-17-2016
11:33 PM
- Mark as New
- Bookmark Message
- Subscribe to Message
- Mute Message
- Subscribe to RSS Feed
- Permalink
- Report Inappropriate Content
intern_jos
Engager
01-18-2016
04:42 PM
Hi,
Thanks for this answer but sadly mine is Splunk 6.2 so does not have this function.
It would be great for Splunk 6.3 users!
Get Updates on the Splunk Community!
Threat Hunting Unlocked: How to Uplevel Your Threat Hunting With the PEAK Framework ...
WATCH NOWAs AI starts tackling low level alerts, it's more critical than ever to uplevel your threat hunting ...
Splunk APM: New Product Features + Community Office Hours Recap!
Howdy Splunk Community! Over the past few months, we’ve had a lot going on in the world of Splunk Application ...
Index This | Forward, I’m heavy; backward, I’m not. What am I?
April 2024 Edition
Hayyy Splunk Education Enthusiasts and the Eternally Curious!
We’re back with another ...


