- Apps and Add-ons
- :
- All Apps and Add-ons
- :
- Re: Website monitoring Web Ping Logs returns a res...
- Subscribe to RSS Feed
- Mark Topic as New
- Mark Topic as Read
- Float this Topic for Current User
- Bookmark Topic
- Subscribe to Topic
- Mute Topic
- Printer Friendly Page
- Mark as New
- Bookmark Message
- Subscribe to Message
- Mute Message
- Subscribe to RSS Feed
- Permalink
- Report Inappropriate Content
Website monitoring Web Ping Logs returns a response code of 403.
Installed the website monitoring app on an instance of a Splunk Heavy Forwarder (version 7.1.4).
Followed the application configurations as documented , but notice that the web_ping logs indicate a response code of 403.
proxy_server= title= content_size=3858 total_time=14.33 timed_out=False response_code=403 request_time=14.33 proxy_port=8080 content_md5=1993358fa020a17c6a2f89e06442a8de url= content_sha224=76efe249f30e0f9c23d048853e6de43dd1b24e127f0e3056ea8cea44 proxy_type=http
Any ideas why this could be the case ?
Regards
Mukund M
- Mark as New
- Bookmark Message
- Subscribe to Message
- Mute Message
- Subscribe to RSS Feed
- Permalink
- Report Inappropriate Content
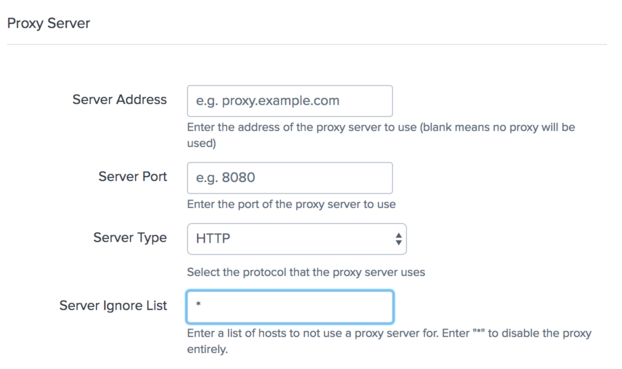
Version 2.7.4 has a solution for this. The app now includes the ability to be told not to use the proxy server even if you have a proxy server defined using environment variables (often in $SPLUNK_HOME/etc/splunk-launch.conf) but you don't want the Website Monitoring app to use it.
To get around this, define a value for the proxy_ignore setting in website_monitoring.conf. You can also set this using the setup page for the Website Monitoring app. Set the value of the "Server Ignore List" to "*", like this:
- Mark as New
- Bookmark Message
- Subscribe to Message
- Mute Message
- Subscribe to RSS Feed
- Permalink
- Report Inappropriate Content
Hey @LukeMurphey , Thanks for a quick update and release. I am testing this out now.
Question : While configuring inputs we have an option to specify the proxy configs (would these take precedence over the Server Ignore list property) ?
- Mark as New
- Bookmark Message
- Subscribe to Message
- Mute Message
- Subscribe to RSS Feed
- Permalink
- Report Inappropriate Content
@LukeMurphey - Unfortunately , still see the 403 errors as before.
Started to work as soon as we disabled the ENV variables defined in the splunk-launch.conf .
- Mark as New
- Bookmark Message
- Subscribe to Message
- Mute Message
- Subscribe to RSS Feed
- Permalink
- Report Inappropriate Content
Is it possible that its the Proxy asking for auth (and thus generating the 403 because you are not authenticated on the proxy) rather than the target website?
- Mark as New
- Bookmark Message
- Subscribe to Message
- Mute Message
- Subscribe to RSS Feed
- Permalink
- Report Inappropriate Content
Hmm, there is no auth credentials being passed.
Additionally adding debug statements in the add-on , there are no proxy params being used while issuing the request.
- Mark as New
- Bookmark Message
- Subscribe to Message
- Mute Message
- Subscribe to RSS Feed
- Permalink
- Report Inappropriate Content
That could explain why you get 403 with the proxy, and 200 without then.
You could try with curl to test:
export https_proxy=https://your.proxy.server:8080
curl google.com -Lvv
- Mark as New
- Bookmark Message
- Subscribe to Message
- Mute Message
- Subscribe to RSS Feed
- Permalink
- Report Inappropriate Content
Hello @LukeMurphey ,
I was able to find a way for you to reproduce the issue on your end.
We found the reason why the addon is breaking for certain endpoints.
All instances of our Splunk installation have HTTP_PROXY and HTTPS_PROXY env variables defined under
HTTP_PROXY = XXXXX
HTTPS_PROXY = XXXXX
We had to comment out the above two lines for the add on to work.
The strange issue is that (no proxies are being used by the add-on when making the HTTP request) - we verified this by logging the proxy parameters when the
request is being made.
This is just a hack and we would not want to disable the global proxy confs (as there might be other addons that could break as a result of this)
So basically to reproduce the bug , all that would be needed is to add Proxy setting in the "/opt/splunk/etc/splunk-launch.conf" file.
Regards
Mukund M
- Mark as New
- Bookmark Message
- Subscribe to Message
- Mute Message
- Subscribe to RSS Feed
- Permalink
- Report Inappropriate Content
Oh awesome! Thank you so much for tracking this down.
I wrote up a bug and play to fix this soon: https://lukemurphey.net/issues/2373
- Mark as New
- Bookmark Message
- Subscribe to Message
- Mute Message
- Subscribe to RSS Feed
- Permalink
- Report Inappropriate Content
The site might require authentication. An HTTP 403 response usually indicates that access to the website was denied due to authentication not succeeding.
I'm willing to try to reproduce the problem on my end if the website is publicly available and you provide the URL.
- Mark as New
- Bookmark Message
- Subscribe to Message
- Mute Message
- Subscribe to RSS Feed
- Permalink
- Report Inappropriate Content
Thanks for the quick response Luke, unfortunately this is an internal URL , which would make it difficult to reproduce.
Interestingly - I can curl from the Heavy Forwarder box directly to the URL without needing a Proxy, and the response returned is 200.
Stay Connected: Your Guide to May Tech Talks, Office Hours, and Webinars!
They're back! Join the SplunkTrust and MVP at .conf24
Enterprise Security Content Update (ESCU) | New Releases
