- Apps and Add-ons
- :
- All Apps and Add-ons
- :
- dbxquery not giving data in email alert
- Subscribe to RSS Feed
- Mark Topic as New
- Mark Topic as Read
- Float this Topic for Current User
- Bookmark Topic
- Subscribe to Topic
- Mute Topic
- Printer Friendly Page
- Mark as New
- Bookmark Message
- Subscribe to Message
- Mute Message
- Subscribe to RSS Feed
- Permalink
- Report Inappropriate Content
Hi
I am unable to get dbxquery data out to an alert.
When i run the alert normally i can see that data, when i put it into an alert it also is fine.
But it wont send the data to an email address, i get the following error below.
02-24-2020 11:24:05.142 +0100 ERROR ScriptRunner - stderr from '/hp737srv2/apps/splunk/bin/python /hp737srv2/apps/splunk/etc/apps/search/bin/sendemail.py "results_link=http://hp737srv:8000/app/Murex/@go?sid=scheduler__admin__Murex__RMD53b83008a35dc2834_at_1582539840_32896" "ssname=PAC_PLO_blockedSybProc_TO_BE_DELETED_2" "graceful=True" "trigger_time=1582539844" results_file="/hp737srv2/apps/splunk/var/run/splunk/dispatch/scheduler__admin__Murex__RMD53b83008a35dc2834_at_1582539840_32896/results.csv.gz"': _csv.Error: line contains NULL byte
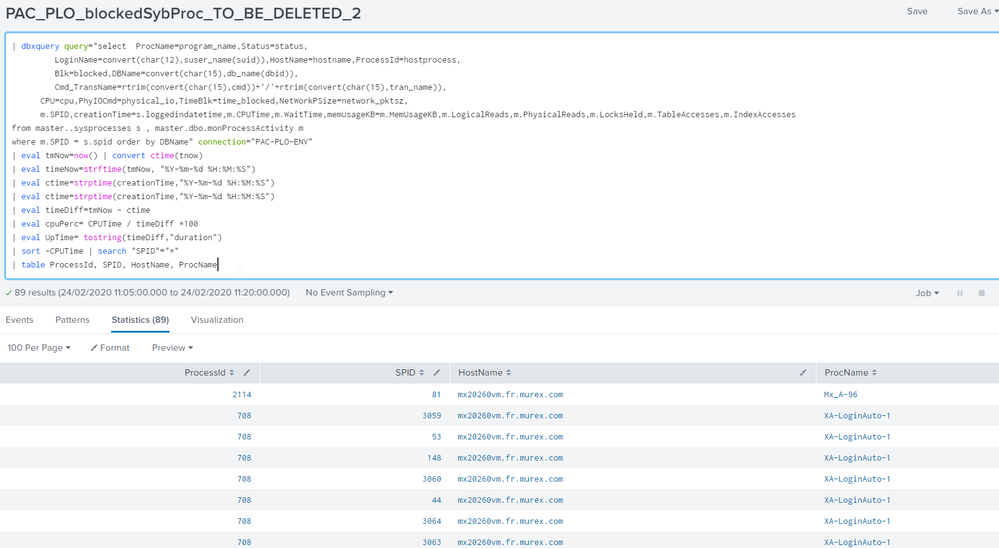
Below is the query that i am using. I am running it with a cron * * * * * for testing.
| dbxquery query="select  ProcName=program_name,Status=status,
         LoginName=convert(char(12),suser_name(suid)),HostName=hostname,ProcessId=hostprocess,
         Blk=blocked,DBName=convert(char(15),db_name(dbid)),
         Cmd_TransName=rtrim(convert(char(15),cmd))+'/'+rtrim(convert(char(15),tran_name)),
      CPU=cpu,PhyIOCmd=physical_io,TimeBlk=time_blocked,NetWorkPSize=network_pktsz,
      m.SPID,creationTime=s.loggedindatetime,m.CPUTime,m.WaitTime,memUsageKB=m.MemUsageKB,m.LogicalReads,m.PhysicalReads,m.LocksHeld,m.TableAccesses,m.IndexAccesses
from master..sysprocesses s , master.dbo.monProcessActivity m
where m.SPID = s.spid order by DBName" connection="PAC-PLO-ENV"
| eval tmNow=now() | convert ctime(tnow)
| eval timeNow=strftime(tmNow, "%Y-%m-%d %H:%M:%S")
| eval ctime=strptime(creationTime,"%Y-%m-%d %H:%M:%S")
| eval ctime=strptime(creationTime,"%Y-%m-%d %H:%M:%S")
| eval timeDiff=tmNow - ctime
| eval cpuPerc= CPUTime / timeDiff *100
| eval UpTime= tostring(timeDiff,"duration")
| sort -CPUTime | search "SPID"="*"
| table ProcessId, SPID, HostName, ProcName
Below is the data i can see, but i just cant get it into a email!! any ideas would be great thanks
- Mark as New
- Bookmark Message
- Subscribe to Message
- Mute Message
- Subscribe to RSS Feed
- Permalink
- Report Inappropriate Content
Hi
To get over this i created a workaround.
In an alert i pushed this data out to an index
|collect index=yourindex source=yoursource
Then in the original Alert i references the index not the | dbxquery data and the alert worked.
So i think there must be a bug in Splunk.
Regards
Robert

