- Splunk Answers
- :
- Splunk Administration
- :
- Security
- :
- Chart of unique user logins per day
- Subscribe to RSS Feed
- Mark Topic as New
- Mark Topic as Read
- Float this Topic for Current User
- Bookmark Topic
- Subscribe to Topic
- Mute Topic
- Printer Friendly Page
- Mark as New
- Bookmark Message
- Subscribe to Message
- Mute Message
- Subscribe to RSS Feed
- Permalink
- Report Inappropriate Content
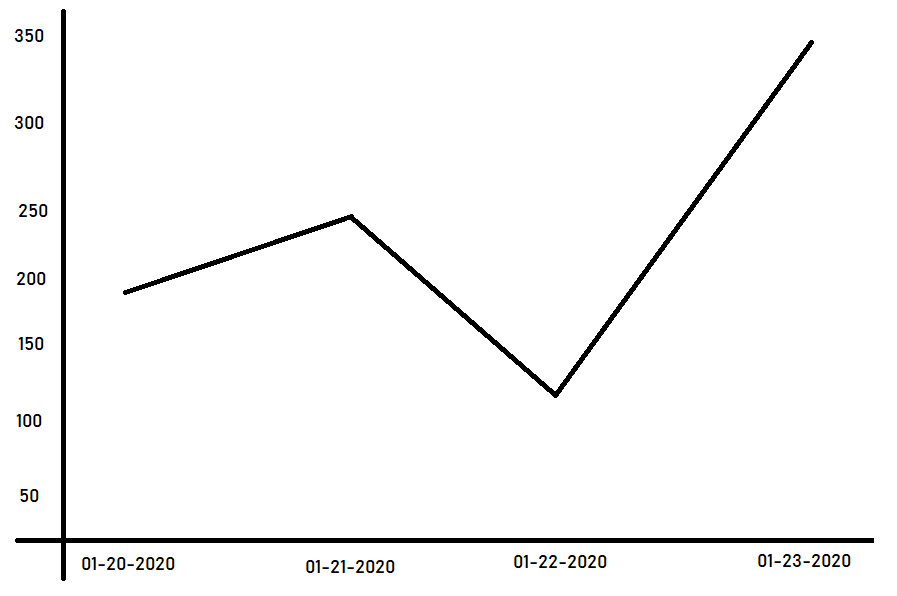
I feel like an idiot because this should be simple. I'm trying to get a basic graph showing unique user logins per day for our Splunk Cloud environment. This search came from the "Utilization Monitor for Splunk" app and I thought it would be as easy as adding "by day" to the stats segment but that didn't work.
index=_audit user!="splunk-system-user" user!="N/A" user=* host=* NOT (action=log* info=fail*) | stats dc(user) as "Splunkers"
If I were the only user to log in and I only work mon-fri then I would expect the chart to be something like 0,1,1,1,1,1,0.
Can someone please point out what I'm missing before I lose the little hair I have left?
- Mark as New
- Bookmark Message
- Subscribe to Message
- Mute Message
- Subscribe to RSS Feed
- Permalink
- Report Inappropriate Content
index=_audit user!="splunk-system-user" user!="N/A" user=* host=* NOT (action=log* info=fail*)
| eval date_wday=strftime(_time,"%F")
| chart dc(user) as "Splunkers" by  date_wday,user
| eval date_wday=strftime(strptime(date_wday,"%F"),"%A")
- Mark as New
- Bookmark Message
- Subscribe to Message
- Mute Message
- Subscribe to RSS Feed
- Permalink
- Report Inappropriate Content
index=_audit user!="splunk-system-user" user!="N/A" user=* host=* NOT (action=log* info=fail*)
| eval date_wday=strftime(_time,"%F")
| chart dc(user) as "Splunkers" by date_wday
Thank you! The strftime is the key for getting the data I needed.
- Mark as New
- Bookmark Message
- Subscribe to Message
- Mute Message
- Subscribe to RSS Feed
- Permalink
- Report Inappropriate Content
Hi,
Try this
index=_audit user!="splunk-system-user" user!="N/A" user=* host=* NOT (action=log* info=fail*) | chart dc(user) as "Splunkers" by user , date_wday
Thanks
Anantha
- Mark as New
- Bookmark Message
- Subscribe to Message
- Mute Message
- Subscribe to RSS Feed
- Permalink
- Report Inappropriate Content
That broke it down more granularly than I was looking for. I updated the question with an example chart.

