- Splunk Answers
- :
- Using Splunk
- :
- Dashboards & Visualizations
- :
- How i can add different drill down for each output...
- Subscribe to RSS Feed
- Mark Topic as New
- Mark Topic as Read
- Float this Topic for Current User
- Bookmark Topic
- Subscribe to Topic
- Mute Topic
- Printer Friendly Page
- Mark as New
- Bookmark Message
- Subscribe to Message
- Mute Message
- Subscribe to RSS Feed
- Permalink
- Report Inappropriate Content
Hello
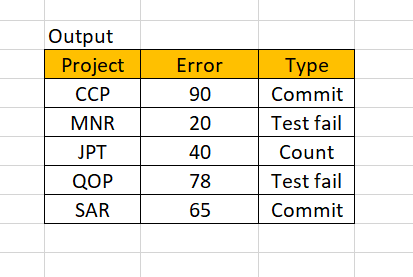
How i can add different drill down for each output in the panel.
i have created separate dashboard for each project just want to add drill down so that if i selected
CCP -- new dashboard ll open for CCP
similarly
MNR - - new dashboard ll open for MNR
JPT - - new dashboard ll open for JPT
SAR - - new dashboard ll open for SAR
Please find the attachment of the output.
Thanks in advance
- Mark as New
- Bookmark Message
- Subscribe to Message
- Mute Message
- Subscribe to RSS Feed
- Permalink
- Report Inappropriate Content
<dashboard>
<label>drilldown new panel</label>
<row>
<panel>
<table>
<search>
<query>| makeresults count=400
| streamstats count
| eval Project=mvindex(split("CCP#MNR#JPT#SAR#QOP","#"),(random() % 5))
| eval Type=case(Project="CCP" OR Project="SAR","Commit",Project="MNR" OR Project="QOP","Test Fail",Project="JPT","Count")
| stats values(Type) as Type count by Project</query>
<earliest>-4h@m</earliest>
<latest>now</latest>
<sampleRatio>1</sampleRatio>
</search>
<option name="count">20</option>
<option name="dataOverlayMode">none</option>
<option name="drilldown">cell</option>
<option name="percentagesRow">false</option>
<option name="rowNumbers">false</option>
<option name="totalsRow">false</option>
<option name="wrap">true</option>
<drilldown>
<link target="_blank">search?q=%7C%20makeresults%20count=400%0A%7C%20streamstats%20count%0A%7C%20eval%20Project=mvindex(split(%22CCP#MNR#JPT#SAR#QOP%22,%22#%22),(random()%20%25%205))%0A%7C%20eval%20Type=case(Project=%22CCP%22%20OR%20Project=%22SAR%22,%22Commit%22,Project=%22MNR%22%20OR%20Project=%22QOP%22,%22Test%20Fail%22,Project=%22JPT%22,%22Count%22)%0A%7C%20search%20Project=$click.value$&earliest=-4h@m&latest=now</link>
</drilldown>
</table>
</panel>
</row>
</dashboard>
I tried to make it.
- Mark as New
- Bookmark Message
- Subscribe to Message
- Mute Message
- Subscribe to RSS Feed
- Permalink
- Report Inappropriate Content
@hrs2019 as per your question seemed like you wanted to drilldown to separate dashboards depending on the different projects. However, seems like you are just opening the same same search with different search tokens as per your accepted answer. You can try one of the following options:
- Use hidden field for drilldown to specific Project's app and/or dashboard. This could be done by prefixing dashboard link column/field name with underscore. For example,
_HiddenDashboardLink. Prefixing underscore to the column name hides the column in the table but keeps it available for drilldown i.e. through$row._HiddenDashboardLink$ Similarly to the above approach you can create link for specific project's dashboard using case statement and name it anything meaningful like
HiddenDashboardLink. Then use the Simple XML<fields>configuration to show only Project, Error and Type. This was fieldHiddenDashboardLinkdoes not show up in the table but$row.HiddenDashboardLink$can be used for drilldown.<!-- Use the fields option to list the result fields to explicitly display -->
Project, Error,Type
Refer to a very old answer on similar lines: https://answers.splunk.com/answers/569560/dashboard-drilldown-user-clicks-on-value-search-is.html
You should check out Splunk Dashboard Examples app from Splunkbase to learn about the two relevant examples for your use case i.e. Table Element with Hidden Fields and Drilldown Link to Dashboard where link to dashboard would be through hidden field $row.HiddenDashboardLink$, depending on the Project in the corresponding row using case() eval function.
| makeresults | eval message= "Happy Splunking!!!"
- Mark as New
- Bookmark Message
- Subscribe to Message
- Mute Message
- Subscribe to RSS Feed
- Permalink
- Report Inappropriate Content
You should be able to use <eval token="drilldown_token" just above your drilldown with a case() statement to set $drilldown_token$ that you can then use in your drilldown.
- Mark as New
- Bookmark Message
- Subscribe to Message
- Mute Message
- Subscribe to RSS Feed
- Permalink
- Report Inappropriate Content
<dashboard>
<label>drilldown new panel</label>
<row>
<panel>
<table>
<search>
<query>| makeresults count=400
| streamstats count
| eval Project=mvindex(split("CCP#MNR#JPT#SAR#QOP","#"),(random() % 5))
| eval Type=case(Project="CCP" OR Project="SAR","Commit",Project="MNR" OR Project="QOP","Test Fail",Project="JPT","Count")
| stats values(Type) as Type count by Project</query>
<earliest>-4h@m</earliest>
<latest>now</latest>
<sampleRatio>1</sampleRatio>
</search>
<option name="count">20</option>
<option name="dataOverlayMode">none</option>
<option name="drilldown">cell</option>
<option name="percentagesRow">false</option>
<option name="rowNumbers">false</option>
<option name="totalsRow">false</option>
<option name="wrap">true</option>
<drilldown>
<link target="_blank">search?q=%7C%20makeresults%20count=400%0A%7C%20streamstats%20count%0A%7C%20eval%20Project=mvindex(split(%22CCP#MNR#JPT#SAR#QOP%22,%22#%22),(random()%20%25%205))%0A%7C%20eval%20Type=case(Project=%22CCP%22%20OR%20Project=%22SAR%22,%22Commit%22,Project=%22MNR%22%20OR%20Project=%22QOP%22,%22Test%20Fail%22,Project=%22JPT%22,%22Count%22)%0A%7C%20search%20Project=$click.value$&earliest=-4h@m&latest=now</link>
</drilldown>
</table>
</panel>
</row>
</dashboard>
I tried to make it.
- Mark as New
- Bookmark Message
- Subscribe to Message
- Mute Message
- Subscribe to RSS Feed
- Permalink
- Report Inappropriate Content
- Mark as New
- Bookmark Message
- Subscribe to Message
- Mute Message
- Subscribe to RSS Feed
- Permalink
- Report Inappropriate Content
Each panel can have a single drilldown.
If this reply helps you, Karma would be appreciated.
- Mark as New
- Bookmark Message
- Subscribe to Message
- Mute Message
- Subscribe to RSS Feed
- Permalink
- Report Inappropriate Content
@richgalloway yes but i am not getting the correct drilldown details.
- Mark as New
- Bookmark Message
- Subscribe to Message
- Mute Message
- Subscribe to RSS Feed
- Permalink
- Report Inappropriate Content
What are your drilldown settings? What details do you expect? What details are you getting?
If this reply helps you, Karma would be appreciated.

