Turn on suggestions
Auto-suggest helps you quickly narrow down your search results by suggesting possible matches as you type.
Showing results for
Splunk Search
Turn on suggestions
Auto-suggest helps you quickly narrow down your search results by suggesting possible matches as you type.
Showing results for
- Splunk Answers
- :
- Using Splunk
- :
- Splunk Search
- :
- Table keep last event by criteria
Options
- Subscribe to RSS Feed
- Mark Topic as New
- Mark Topic as Read
- Float this Topic for Current User
- Bookmark Topic
- Subscribe to Topic
- Mute Topic
- Printer Friendly Page
- Mark as New
- Bookmark Message
- Subscribe to Message
- Mute Message
- Subscribe to RSS Feed
- Permalink
- Report Inappropriate Content
erwanlebaron
Engager
11-20-2019
09:34 AM
Hi
I've a question regarding stat or eventstat option last.
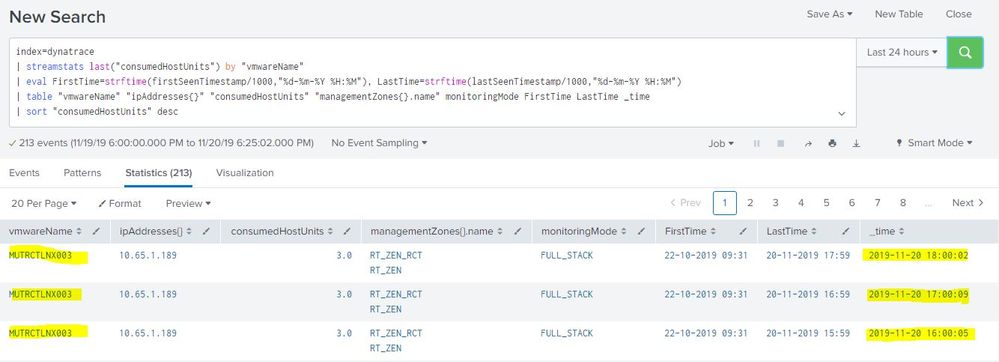
I would like to keep the last "event" in a table with several informations and I don't succeed.
index=dynatrace
| streamstats last("consumedHostUnits") by "vmwareName"
| eval FirstTime=strftime(firstSeenTimestamp/1000,"%d-%m-%Y %H:%M"), LastTime=strftime(lastSeenTimestamp/1000,"%d-%m-%Y %H:%M")
| table "vmwareName" "ipAddresses{}" "consumedHostUnits" "managementZones{}.name" monitoringMode FirstTime LastTime _time
| sort "consumedHostUnits" desc
And I've 3 times a row for a server
And if I use "stats" instead of "eventstats" I lost data for the others column
index=dynatrace
| stats last("consumedHostUnits") as HU by "vmwareName"
| eval FirstTime=strftime(firstSeenTimestamp/1000,"%d-%m-%Y %H:%M"), LastTime=strftime(lastSeenTimestamp/1000,"%d-%m-%Y %H:%M")
| sort HU desc
| table "vmwareName" "ipAddresses{}" HU "managementZones{}.name" monitoringMode FirstTime LastTime _time
What is the solution to have the first screenshot with only a single line as the second screenshot ?
Regards
1 Solution
- Mark as New
- Bookmark Message
- Subscribe to Message
- Mute Message
- Subscribe to RSS Feed
- Permalink
- Report Inappropriate Content
mayurr98
Super Champion
11-20-2019
10:27 AM
try this:
index=dynatrace
| stats last("consumedHostUnits") as HU values(firstSeenTimestamp) as firstSeenTimestamp values(lastSeenTimestamp) as lastSeenTimestamp values("ipAddresses{}") as "ipAddresses{}" values("managementZones{}.name") as "managementZones{}.name" values(monitoringMode) as monitoringMode values(_time) as time by "vmwareName"
| eval FirstTime=strftime(firstSeenTimestamp/1000,"%d-%m-%Y %H:%M"), LastTime=strftime(lastSeenTimestamp/1000,"%d-%m-%Y %H:%M")
| convert ctime(time) as time
| sort HU desc
| table "vmwareName" "ipAddresses{}" HU "managementZones{}.name" monitoringMode FirstTime LastTime time
- Mark as New
- Bookmark Message
- Subscribe to Message
- Mute Message
- Subscribe to RSS Feed
- Permalink
- Report Inappropriate Content
erwanlebaron
Engager
11-21-2019
12:17 AM
I was exactly what I was looking for.
I hadn't understood the "values" while using stats.
Thanks a lot
- Mark as New
- Bookmark Message
- Subscribe to Message
- Mute Message
- Subscribe to RSS Feed
- Permalink
- Report Inappropriate Content
mayurr98
Super Champion
11-20-2019
10:27 AM
try this:
index=dynatrace
| stats last("consumedHostUnits") as HU values(firstSeenTimestamp) as firstSeenTimestamp values(lastSeenTimestamp) as lastSeenTimestamp values("ipAddresses{}") as "ipAddresses{}" values("managementZones{}.name") as "managementZones{}.name" values(monitoringMode) as monitoringMode values(_time) as time by "vmwareName"
| eval FirstTime=strftime(firstSeenTimestamp/1000,"%d-%m-%Y %H:%M"), LastTime=strftime(lastSeenTimestamp/1000,"%d-%m-%Y %H:%M")
| convert ctime(time) as time
| sort HU desc
| table "vmwareName" "ipAddresses{}" HU "managementZones{}.name" monitoringMode FirstTime LastTime time
Get Updates on the Splunk Community!
Stay Connected: Your Guide to May Tech Talks, Office Hours, and Webinars!
Take a look below to explore our upcoming Community Office Hours, Tech Talks, and Webinars this month. This ...
They're back! Join the SplunkTrust and MVP at .conf24
With our highly anticipated annual conference, .conf, comes the fez-wearers you can trust! The SplunkTrust, as ...
Enterprise Security Content Update (ESCU) | New Releases
Last month, the Splunk Threat Research Team had two releases of new security content via the Enterprise ...


