- Splunk Answers
- :
- Using Splunk
- :
- Dashboards & Visualizations
- :
- Problem changing cell color in dashboard
- Subscribe to RSS Feed
- Mark Topic as New
- Mark Topic as Read
- Float this Topic for Current User
- Bookmark Topic
- Subscribe to Topic
- Mute Topic
- Printer Friendly Page
- Mark as New
- Bookmark Message
- Subscribe to Message
- Mute Message
- Subscribe to RSS Feed
- Permalink
- Report Inappropriate Content
Problem changing cell color in dashboard
Using Splunk Enterprise v7.2.1
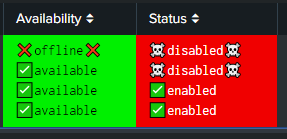
I'm creating a dashboard and want to change the colors of some of my cells based on the field value. I'm having a very hard time getting this to work as expected. What happens is that if ANY of the fields in the column match the if(like)) condition, ALL of the cells are set to that color. If none of the cell match, then they're set to the NOT IF color. Here're the format lines from the XML (they follow the option tags):
        <format type="color" field="Availability">
          <colorPalette type="expression">if(like(value,"%available"), "#00F000", "#F00000")</colorPalette>
        </format>
        <format type="color" field="Status">
          <colorPalette type="expression">if(like(value,"%Nope"), "#00F000", "#F00000")</colorPalette>
        </format>
And here's what the output looks like:
I purposely chose a string that doesn't match anything in the "Status" column to illustrate what's happening here.
I'm using unicode characters because I don't want to mess with icons, java, and .css files just now - the formats behave the same way if I remove the characters anyway. I've also tried if(value=="whatever", "#00F000", "#F00000") as well as if(match(...),...) to no avail.
The query I'm using is:
| from datamodel:"bigip-tmsh-pool_member_status.all"
| eval check="✅"
| eval warn="⚠️"
| eval error="❌"
| eval critical="☠️"
| where host=$host$ AND pool_name="$pool_name$"
| dedup pool_member_name
| sort enabled_state availability_state
| eval availability_state=if(availability_state="offline", error.availability_state.error, check.availability_state)
| eval enabled_state=if(enabled_state="disabled", critical.enabled_state.critical, check.enabled_state)
| convert ctime(_time) as event_time
| sort pool_member_name
| stats list(event_time) as "Last Checkin" list(pool_member_name) as "Pool Member" list(availability_state) as "Availability" list(enabled_state) as "Status" list(status_reason) as "Status Msg"
I'm at a loss and would appreciate any assistance.
- Mark as New
- Bookmark Message
- Subscribe to Message
- Mute Message
- Subscribe to RSS Feed
- Permalink
- Report Inappropriate Content
Hmmmm. I was using |stats because I had a couple 'by' clauses that I decided were redundant. I changed the final line to a table and now the formatting works.
Curious why it didn't work with the 'stat' command but does with the 'table' because I do use stats in other places where this would be nice. So, while this isn't so pressing now, it would be nice to understand why this didn't work with a stats table but it did work with a table, errr, table.
Thanks for your attention!
- Mark as New
- Bookmark Message
- Subscribe to Message
- Mute Message
- Subscribe to RSS Feed
- Permalink
- Report Inappropriate Content
I know this is an old message and you probably figured it out by now, but just in case...
The "stats" command can turn multiple events into 1 event. You're using list() which will create mv (multi-valued) fields. To illustrate, you started with:
         status ...
event 1: good ...
event 2: bad ...
event 3: good ...
event 4: bad ...
When you do a search like: | stats list(status) as status, ..., you end up with:
         status
event 1: good
         bad
         good
         bad
So the coloring is for 1 "cell", not 4 "cells".

