- Splunk Answers
- :
- Using Splunk
- :
- Splunk Search
- :
- How to create a pie chart with only true false val...
- Subscribe to RSS Feed
- Mark Topic as New
- Mark Topic as Read
- Float this Topic for Current User
- Bookmark Topic
- Subscribe to Topic
- Mute Topic
- Printer Friendly Page
- Mark as New
- Bookmark Message
- Subscribe to Message
- Mute Message
- Subscribe to RSS Feed
- Permalink
- Report Inappropriate Content
How to create a pie chart with only true false values
I am working with this search:
index=lab-testresults type=browser NOT(browser="UK*" OR browser="Firefox") suiteID="*"
| stats latest(success) as success by browser noxID
| stats count(eval(success="true")) as PassCount
    count(eval(success="false")) as FailCount
    count as Total by browser
| fields browser, PassCount, FailCount, Total
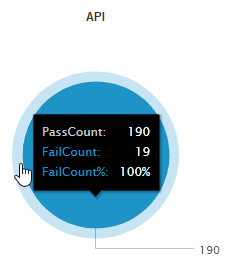
but when I use the trellis on my visualization, the pie charts only show a single value like this:
The Question:
How do I get it so that each of my pie charts shows the correct slice of passes and failures according to the data and not just one field like it is now?
I am working with this search query:
index=lab-testresults type=browser NOT(browser="UK*" OR browser="Firefox") suiteID="*"
| stats latest(success) as success by browser noxID
| stats count(eval(success="true")) as PassCount
    count(eval(success="false")) as FailCount
    count as Total by browser
| fields browser, PassCount, FailCount, Total
but every time I use trellis on a dashboard it shows this:
This only shows a whole pie chart, but we can see that both counts are there, and adding the Total that we define in the count above also doesn't change the problem.
I would like the pie chart to display the passes and the failures as two separate parts of the pie. Is there any way to do this?
(additional context: I am later going to add charting.fieldColors to this pie so that passes are green and failures are red, so any way to do show the two parts of the pie, with labels for passes and fails, and finally adding in the colors would be great!)
Thanks!
- Mark as New
- Bookmark Message
- Subscribe to Message
- Mute Message
- Subscribe to RSS Feed
- Permalink
- Report Inappropriate Content
Try the chart command, instead of stats:
index=lab-testresults type=browser NOT(browser="UK*" OR browser="Firefox") suiteID="*"
| stats latest(success) as success by browser noxID
| chart count over browser by success
| rename true as PassCount
| rename false as FailCount
- Mark as New
- Bookmark Message
- Subscribe to Message
- Mute Message
- Subscribe to RSS Feed
- Permalink
- Report Inappropriate Content
Hi disillusioned,
which field do you used for the "Split by" option ?
<option name="trellis.splitBy">broser</option>
For more information see the Splunk Dashboard Examples App ( https://splunkbase.splunk.com/app/1603/ ).
Bye.
Giuseppe


