- Splunk Answers
- :
- Using Splunk
- :
- Splunk Search
- :
- Why does Splunk include null columns in data by de...
- Subscribe to RSS Feed
- Mark Topic as New
- Mark Topic as Read
- Float this Topic for Current User
- Bookmark Topic
- Subscribe to Topic
- Mute Topic
- Printer Friendly Page
- Mark as New
- Bookmark Message
- Subscribe to Message
- Mute Message
- Subscribe to RSS Feed
- Permalink
- Report Inappropriate Content
This is something I've always wondered, and I can't understand the reasoning behind it or how to fix it.
This is my search:
index=_internal "alert_name" source="/opt/splunk/var/log/splunk/scheduler.log"
| table *
The search yields 144 results. Of those 144 results, there are roughly 30 fields total.
So why, when I run |table * do I get 100+ fields showing up in my table?
The only reason I can think of that makes sense is that Splunk is automatically displaying every field that exists in that source/sourcetype, regardless of if it's being used in the current dataset. If that is the case, what is the reasoning behind that? It seems terribly inefficient and impractical to load a ton of empty fields.
I know there are tricks to get around this problem, such as:
|...base search...
| streamstats count as temp_count
| stats values(*) as * by temp_count
| fields - temp_count
But it seems ridiculous that removing null columns isn't how Splunk works with fields by default.
I feel like I have a fundamental misunderstanding of this, and would appreciate any guidance on not only why it happens, but what I can do only show non-null columns in my data by default in the future.
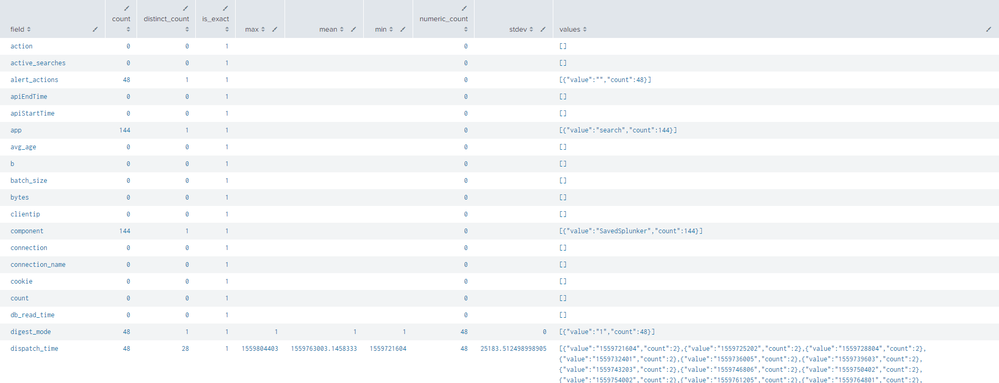
Below is a snippet of my dataset. As you can see, over half of the fields contain no data at all.
- Mark as New
- Bookmark Message
- Subscribe to Message
- Mute Message
- Subscribe to RSS Feed
- Permalink
- Report Inappropriate Content
If you table everything using a wildcard (not a good idea) you create a column for every field that exists in every event. If a particular event doesn't have that field, you won't get a value for that field (how could you?).
This is expected behaviour. It's not "inefficient and impractical to load a ton of empty fields" because Splunk isn't actually doing that. What you're seeing is schema defined at search time based on what the indexer(s) have returned to the search head.
- Mark as New
- Bookmark Message
- Subscribe to Message
- Mute Message
- Subscribe to RSS Feed
- Permalink
- Report Inappropriate Content
Splunk infers a schema from all results returned from the base search that is everything before the first pipe. If you later throw some events away, the inferred schema is maintained, until you do a | stats, | chart or | timechart at which point, the schema is reset. That's just the way that it is. I worked on some SPL to automagically drop the all-null fields but was unable to get anything to work.
- Mark as New
- Bookmark Message
- Subscribe to Message
- Mute Message
- Subscribe to RSS Feed
- Permalink
- Report Inappropriate Content
If you table everything using a wildcard (not a good idea) you create a column for every field that exists in every event. If a particular event doesn't have that field, you won't get a value for that field (how could you?).
This is expected behaviour. It's not "inefficient and impractical to load a ton of empty fields" because Splunk isn't actually doing that. What you're seeing is schema defined at search time based on what the indexer(s) have returned to the search head.
- Mark as New
- Bookmark Message
- Subscribe to Message
- Mute Message
- Subscribe to RSS Feed
- Permalink
- Report Inappropriate Content
This isn't an issue that is limited to liberal use of the wildcard. I don't believe it is intended behavior.
When a search is made in Smart or Verbose mode, the base search returns schema for events that are not included in the result. The number of fields shown to the user in the "All Fields" can be a small subset of the fields exposed in the table command or a data export.
In the search example that @rbechtold provided, the "alert_name" placeholder may have matched 144 of ~2000 events returned from the indexers. The schema from those other ~2000 events is not shown in the UI. Because of this, I would consider inclusion of null fields for events that are displayed to be unexpected.
| index | _raw | source | |
| Event 1 | _internal | "alert name", k1=val1 | scheduler.log |
| Event 2 | _internal | "name alert", k1=val1, k2=val2, k3=val3 | scheduler.log |
If I searched that data with ` index=_internal "alert name" source=schedular.log `, k2 and k3 would not be shown in the web result GUI. Including them in the table command or a data export is a surprise, especially if Event 2 included hundreds of fields.
I guess something like this could work, and would also work in Fast mode.
index=_internal "alert_name" source="/opt/splunk/var/log/splunk/scheduler.log"
| fields _time, _raw | extract

