- Splunk Answers
- :
- Using Splunk
- :
- Splunk Search
- :
- Dashboard layout - want two visualizations in sing...
- Subscribe to RSS Feed
- Mark Topic as New
- Mark Topic as Read
- Float this Topic for Current User
- Bookmark Topic
- Subscribe to Topic
- Mute Topic
- Printer Friendly Page
- Mark as New
- Bookmark Message
- Subscribe to Message
- Mute Message
- Subscribe to RSS Feed
- Permalink
- Report Inappropriate Content
Dashboard layout - want two visualizations in single panel and condition also.
Hi all,
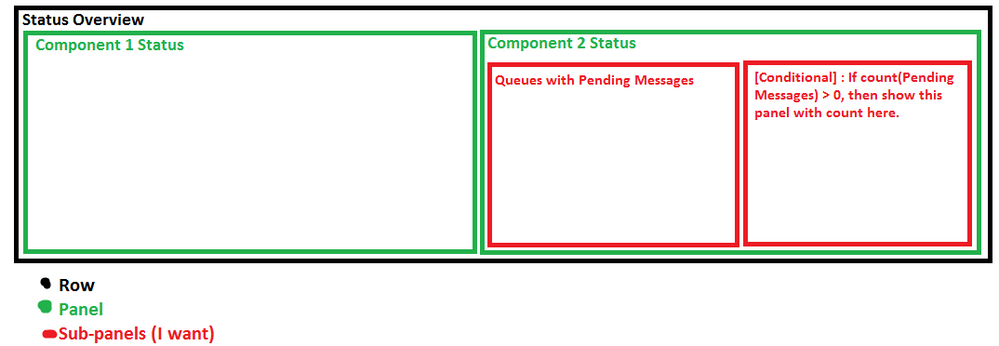
I want the following layout :
I am able to achieve Status Overview layout by :
<row>

<panel></panel>

<panel></panel>

</row>
But not able to create the Component 2 Status panel layout.
The visualization is "Single Value" for both red sub parts.
The first sub part shows percentage of queues with pending messages, and if (percentage > 0) OR we can say if(pendingMessages > 0) then,
show the second sub-part with number of pending messages.
Please Help.
Thanks in advance!
- Mark as New
- Bookmark Message
- Subscribe to Message
- Mute Message
- Subscribe to RSS Feed
- Permalink
- Report Inappropriate Content
@vaibhavvijay9
You can set a token in after completion of first single view search and use it in depends on the second single view chart.
Can you please try below sample XML? You will find your required code in it.
<dashboard>
  <label>Test Dashboard</label>
  <row>
    <panel>
      <title>Component 1 Status</title>
      <chart>
        <search>
          <query>index=_internal | stats count by sourcetype</query>
          <earliest>-15m</earliest>
          <latest>now</latest>
        </search>
        <option name="charting.chart">column</option>
        <option name="charting.drilldown">none</option>
        <option name="refresh.display">progressbar</option>
      </chart>
    </panel>
    <panel>
      <title>Component 2 Status</title>
      <single>
        <title>Single View 1</title>
        <search>
          <finalized>
            <condition match=" 'job.resultCount' != 0">
              <set token="my_tok">True</set>
            </condition>
            <condition>
              <unset token="my_tok"></unset>
            </condition>
          </finalized>
          <query>index=_internal | stats count | where count=1</query>
          <earliest>-15m</earliest>
          <latest>now</latest>
        </search>
        <option name="drilldown">none</option>
        <option name="refresh.display">progressbar</option>
      </single>
      <single depends="$my_tok$">
        <title>Single View 2</title>
        <search>
          <query> | stats count | eval msg="I'm here"</query>
          <earliest>-24h@h</earliest>
          <latest>now</latest>
        </search>
        <option name="drilldown">none</option>
      </single>
    </panel>
  </row>
</dashboard>
You can check with data and without data scenario by updating first single view search.
1) with data: <query>index=_internal | stats count </query>
2) without data: <query>index=_internal | stats count | where count=1</query>
Thanks
- Mark as New
- Bookmark Message
- Subscribe to Message
- Mute Message
- Subscribe to RSS Feed
- Permalink
- Report Inappropriate Content
Thanks @kamlesh_vaghela for the quick response!
I am not able to achieve, my exact scenerio is :
Single View 1 (Percentage) :
...... | stats count(qName) as totalQueues, count(eval(pendingMsgCount > 0)) as queuesWithPendingMessages | eval pendingQueuePercentage =((queuesWithPendingMessages)/totalQueues)*100 | fields pendingQueuePercentage
Single View 2 (sumOfPendingMessages) :
........ | stats sum(pendingMsgCount) as sumOfPendingMsgs
Problem. What condition should I put here : <condition match=" 'job.resultCount' != 0"> according to my string for View 1?
Also test it for static values like :
| eval pendingQueuePercentage =0
| eval pendingQueuePercentage =5
Please help, I will be happy to provide any further inputs.
Awaiting your response.

