- Splunk Answers
- :
- Using Splunk
- :
- Splunk Search
- :
- Why is my single visualization w/trendline total d...
- Subscribe to RSS Feed
- Mark Topic as New
- Mark Topic as Read
- Float this Topic for Current User
- Bookmark Topic
- Subscribe to Topic
- Mute Topic
- Printer Friendly Page
- Mark as New
- Bookmark Message
- Subscribe to Message
- Mute Message
- Subscribe to RSS Feed
- Permalink
- Report Inappropriate Content
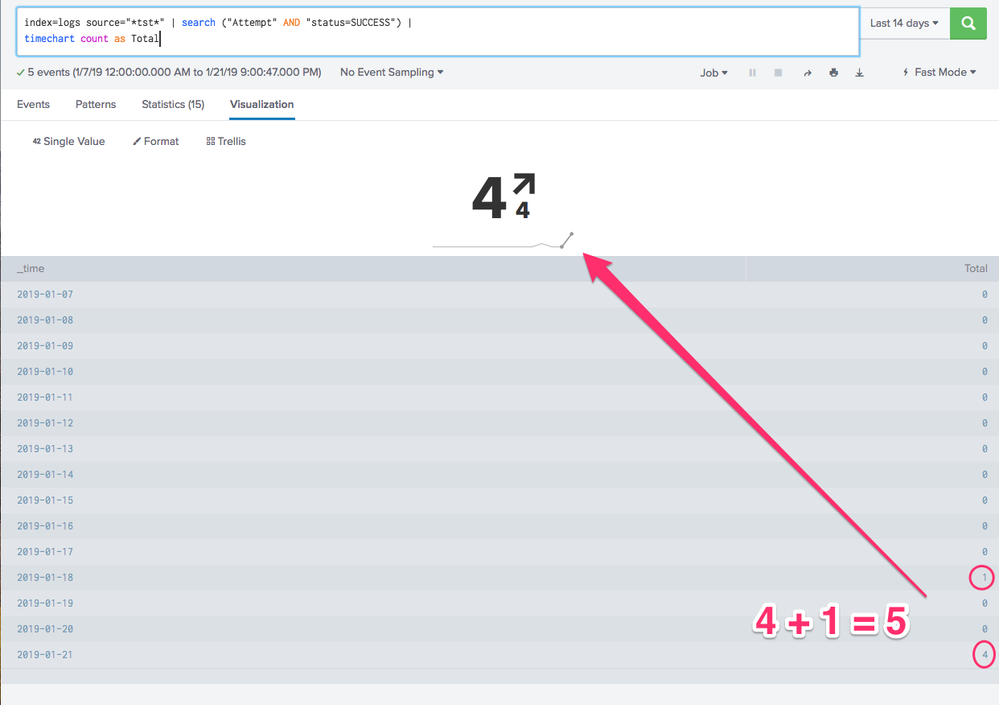
i have the following query and the events/results show "5" but the Single w/Trendline Visualization shows "4".
index=logs source="*tst*" | search ("Attempt" AND "status=SUCCESS") |
timechart count as Total
- Mark as New
- Bookmark Message
- Subscribe to Message
- Mute Message
- Subscribe to RSS Feed
- Permalink
- Report Inappropriate Content
@jaj you should try to understand how single value trendline works first.
By default the trendline result is the lastest value and the trend value is the difference of latest compared to the penultimate number i.e. comparison of last value with second last.
As per your example single value result is 4 (on 01/21) and trend value is 4-0 (0 on 1/20). The same is also highlighted in trendline as last two data point being of bold black color.
PS: You can change the default Compare to option using UI > Edit > Format Visualization or Simple XML.
However in case you need to compare/built trendline with non zero values you have two options
1) use timechart with cont=f which shows only non zero values in the timechart and also breaks the continuity of the chart.
2) use command | filldown which fills null values as previous not null value. Since count fills each time bucket with 0 you may have to tweak the query before using fillnull.
| makeresults | eval message= "Happy Splunking!!!"
- Mark as New
- Bookmark Message
- Subscribe to Message
- Mute Message
- Subscribe to RSS Feed
- Permalink
- Report Inappropriate Content
@niketnilay thanks for the response and explanation.

