- Splunk Answers
- :
- Using Splunk
- :
- Alerting
- :
- Can you help me figure out why i'm seeing delays b...
- Subscribe to RSS Feed
- Mark Topic as New
- Mark Topic as Read
- Float this Topic for Current User
- Bookmark Topic
- Subscribe to Topic
- Mute Topic
- Printer Friendly Page
- Mark as New
- Bookmark Message
- Subscribe to Message
- Mute Message
- Subscribe to RSS Feed
- Permalink
- Report Inappropriate Content
Can you help me figure out why i'm seeing delays between the scheduling and dispatching of my alerts?
Hello,
I have a strange situation with the delays in both scheduling and dispatching of my alerts.
They should run each minute, as per cron schedule:
*/1 * * * *
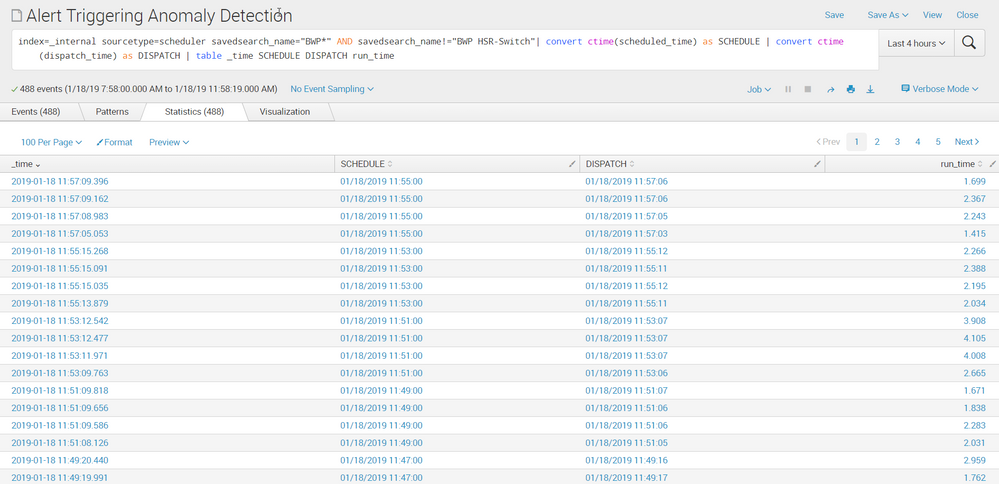
but, when I am checking the schedule and dispatch times I can see that:
1/ The alerts get scheduled each second minute only
2/ There is always a delay between the schedule and dispatch, more less always 2 minutes as well, please see the attached image.
Could you please advise what's going wrong here?
How would I get my alerts executed each minute and get rid of the additional delay between schedule and dispatch?
I thought that the schedule to dispatch delay could come from the resource bottleneck, but there is none.
Also, the fact that it is always 2 minutes would not fit in the resource bottleneck theory.
Are there any parameters that could cause the above behavior?
Kind Regards,
Kamil
- Mark as New
- Bookmark Message
- Subscribe to Message
- Mute Message
- Subscribe to RSS Feed
- Permalink
- Report Inappropriate Content
Hi,
since this sounds like some config is actually telling splunk to wait that 2 minutes you were talking about, I suggest you may
have a look at this :https://answers.splunk.com/answers/550674/splunk-scheduler-how-can-i-reduce-latency-what-can.html
This user is providing knowledge about the schedule_window field for sheduled searches. Might be something you want to check.
- Mark as New
- Bookmark Message
- Subscribe to Message
- Mute Message
- Subscribe to RSS Feed
- Permalink
- Report Inappropriate Content
Any update on this? did you try that?
Please accept the answer if it helped 🙂
- Mark as New
- Bookmark Message
- Subscribe to Message
- Mute Message
- Subscribe to RSS Feed
- Permalink
- Report Inappropriate Content
Hello,
Unfortunately it did not help. The action I took as per the description in link was to grant explicitly the edit_search_schedule_window role to my user in order to get the schedule_window = 0 and not default.
It did not help. I can see all of my and not only my alerts to have a lag of precisely 2 minutes. This is strange, because there are still some other alerts in the system that get dispatched immediately. When I compare the parameters of the both in the system, they seem the same.
1/ my alert with the 2 min lag:
01-23-2019 13:29:15.239 +0100 INFO SavedSplunker - savedsearch_id="nobody;mlbso;Anomaly Detection", search_type="scheduled", user="CDE", app="mlbso", savedsearch_name="Anomaly Detection", priority=default, status=success, digest_mode=1, scheduled_time=1548246420, window_time=0, dispatch_time=1548246548, run_time=5.707, result_count=0, alert_actions="", sid="scheduler__CDE__mlbso__RMD54eeec7fba2d5a846_at_1548246420_4375", suppressed=0, thread_id="AlertNotifierWorker-0"
2/
other alert, dispatched immediately (without lag):
01-23-2019 12:35:01.097 +0000 INFO SavedSplunker - savedsearch_id="nobody;ids;sci_prod_us_east http 5xx", search_type="scheduled", user="ABC", app="ids", savedsearch_name="sci_prod_us_east http 5xx", priority=default, status=success, digest_mode=1, scheduled_time=1548246900, window_time=0, dispatch_time=1548246900, run_time=0.235, result_count=0, alert_actions="", sid="scheduler__ABC__ids__RMD5494dd652a11e08f4_at_1548246900_25299", suppressed=0, thread_id="AlertNotifierWorker-0"
Could you advise?
Is there any way to see the detailed scheduler log for this issueing a search in Splunk?
Waht would be the reason to have this kind of lag?
Kind Regards,
Kamil
- Mark as New
- Bookmark Message
- Subscribe to Message
- Mute Message
- Subscribe to RSS Feed
- Permalink
- Report Inappropriate Content
Hi,
there is a scheduler.log in $SPLUNK_HOME/var/log/splunk ,maybe this could help
- Mark as New
- Bookmark Message
- Subscribe to Message
- Mute Message
- Subscribe to RSS Feed
- Permalink
- Report Inappropriate Content
Hi,
In the scheduler log there is nothing more than the entries as above 1/ and 2/. I am not able to figure out where the lag comes from based on it.
Any further ideas?

