- Splunk Answers
- :
- Using Splunk
- :
- Dashboards & Visualizations
- :
- How to obtain a visualisation based on time (x-axi...
- Subscribe to RSS Feed
- Mark Topic as New
- Mark Topic as Read
- Float this Topic for Current User
- Bookmark Topic
- Subscribe to Topic
- Mute Topic
- Printer Friendly Page
- Mark as New
- Bookmark Message
- Subscribe to Message
- Mute Message
- Subscribe to RSS Feed
- Permalink
- Report Inappropriate Content
Hello,
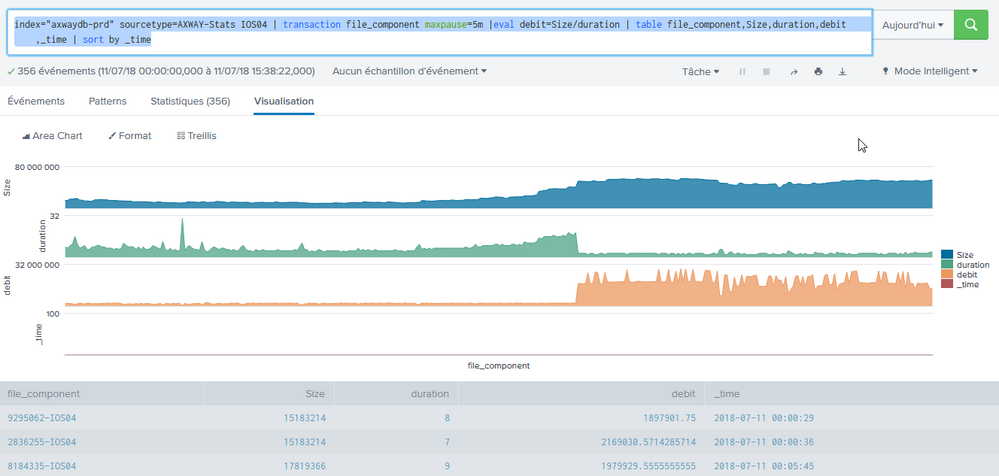
I am using a table type search with visualisation with multiple fields to render.
The purpose of this search is to match two events in a transaction (incoming file and outgoing file) and calculate some infos (bandwidth, duration...)
My search is :
index="" sourcetype= | transaction file_component maxpause=5m |eval debit=Size/duration | table file_component,Size,duration,debit
This give me a multi series visualisation in which "file_component" (the transaction id) is the x-axis, so events are sorted with transaction id but not with time.
I tried to add:
index="" sourcetype= | transaction file_component maxpause=5m |eval debit=Size/duration | table file_component,Size,duration,debit,_time | sort by _time
This worked for sorting the results by time, but X-axis is still based on transaction id and I can't find the date and time of a transfer by just hovering the mouse on the graphs.
Any idea?
Thanks
- Mark as New
- Bookmark Message
- Subscribe to Message
- Mute Message
- Subscribe to RSS Feed
- Permalink
- Report Inappropriate Content
Hi @zebu14,
You could get _time on x-axis by changing the order ie. index="" sourcetype= | transaction file_component maxpause=5m |eval debit=Size/duration | table _time ,file_component,Size,duration,debit
However, normally time based charting is done based on aggregation function using stats/timechart
What goes around comes around. If it helps, hit it with Karma 🙂
- Mark as New
- Bookmark Message
- Subscribe to Message
- Mute Message
- Subscribe to RSS Feed
- Permalink
- Report Inappropriate Content
Thanks for the tip.
I usually use timechart function, but I'm still a beginner and I still don't manage the use of timechart with multiple parameters

