- Splunk Answers
- :
- Using Splunk
- :
- Dashboards & Visualizations
- :
- How to create a chart to show count of events by h...
- Subscribe to RSS Feed
- Mark Topic as New
- Mark Topic as Read
- Float this Topic for Current User
- Bookmark Topic
- Subscribe to Topic
- Mute Topic
- Printer Friendly Page
- Mark as New
- Bookmark Message
- Subscribe to Message
- Mute Message
- Subscribe to RSS Feed
- Permalink
- Report Inappropriate Content
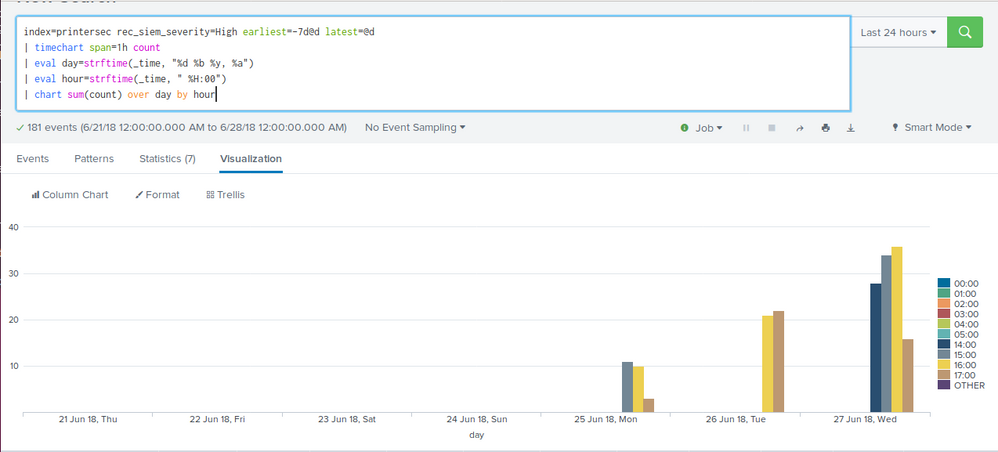
How to create a chart to show count of events by hour over days in a week?
Below is the search query i used in order to get a similar chart but the hours are not consecutive, as shown in the Legend's table on the right side. What i have in mind was to create a chart that displays the count of high severity events by hour in a day for a week and have the chart start on a Monday and ends on a Sunday instead of starting on the current day
I have went and search for various and multiple sources on how to solve this problem and tried using %w, earliest=+7d@w1, | bin span=1d, and so on in my queries in trying to create the desired chart
Thanks and looking forward to replies
- Mark as New
- Bookmark Message
- Subscribe to Message
- Mute Message
- Subscribe to RSS Feed
- Permalink
- Report Inappropriate Content
When you do a timechart it sorts the stack alphabetically; see this run-anywhere example:
index=_internal
|  timechart count BY sourcetype
But you can add an extra line to resort, like this:
index=_internal
|  timechart count BY sourcetype
| table _time splunk* mongo* *
- Mark as New
- Bookmark Message
- Subscribe to Message
- Mute Message
- Subscribe to RSS Feed
- Permalink
- Report Inappropriate Content
- Mark as New
- Bookmark Message
- Subscribe to Message
- Mute Message
- Subscribe to RSS Feed
- Permalink
- Report Inappropriate Content
Hi thanks for your fast reply. I have tried the search query you provided but the problem still lies on the chart not being able to produce events for every single hour from 00:00 to 23:00 and also not in a full week i.e from Monday to Sunday.
The last picture are a separate "hours in a day" and "days in a week" chart. Initially this was the desired output i wanted to have, but the resulting search query im trying to do is a combination of both these charts into one where one day has all individual hours shown in the chart together with the rest of the days and display altogether as a single graph
- Mark as New
- Bookmark Message
- Subscribe to Message
- Mute Message
- Subscribe to RSS Feed
- Permalink
- Report Inappropriate Content
First, you want the count by hour, so you need to bin by hour. Second, once you've added up the bins, you need to present teh output in terms of day and hour.
Here's one version. You can swap the order of hour and day in the chart command if you prefer to swap the column and row headers.
your search that gets the events you want
| bin _time as hour span=1h
| stats count as hourcount by hour
| bin hour as day span=1d
| eval day=strftime(day,"%Y-%m-%d")
| eval hour=strftime(hour,"%H:%M")
| chart sum(hourcount) as count by hour day
- Mark as New
- Bookmark Message
- Subscribe to Message
- Mute Message
- Subscribe to RSS Feed
- Permalink
- Report Inappropriate Content
Hi DalJeanis, i was unable to attach photos in the comments sections so i have posted my reply as an answer. Please do take a look at it. Thanks
- Mark as New
- Bookmark Message
- Subscribe to Message
- Mute Message
- Subscribe to RSS Feed
- Permalink
- Report Inappropriate Content
Hi, Have you tried swapping hour day as mentioned by @DalJeanis?
you have | chart sum(hourcount) as count by day hour
instead of
| chart sum(hourcount) as count by hour day
- Mark as New
- Bookmark Message
- Subscribe to Message
- Mute Message
- Subscribe to RSS Feed
- Permalink
- Report Inappropriate Content
Hi @Sukisen1981. Yes i did. count by hour day was the initial query @DalJeanis provided
- Mark as New
- Bookmark Message
- Subscribe to Message
- Mute Message
- Subscribe to RSS Feed
- Permalink
- Report Inappropriate Content
strange indeed, either we are not understanding your use case or there is something weird going on. Try this query , run it as it is since the audit index is a default one
index="_audit" | bin _time as hour span=1h
| stats count as hourcount by hour
| bin hour as day span=1d
| eval day=strftime(day,"%Y-%m-%d")
| eval hour=strftime(hour,"%H:%M")
| chart sum(hourcount) as count by hour,day
Now, I ran this over a week, month to date and I do receive the hours on xaxis, days on the yaxis...Are you not receiving the same output?
- Mark as New
- Bookmark Message
- Subscribe to Message
- Mute Message
- Subscribe to RSS Feed
- Permalink
- Report Inappropriate Content
@Sukisen1981, i got similar results where days are on the y-axis and hours on the x-axis, but what i was trying to do is to sort of have like a dual x-axis, where the events would show at a one hour interval, and it would show at a span of 1 week


