- Splunk Answers
- :
- Using Splunk
- :
- Splunk Search
- :
- About Real-time alert and "stats" command
- Subscribe to RSS Feed
- Mark Topic as New
- Mark Topic as Read
- Float this Topic for Current User
- Bookmark Topic
- Subscribe to Topic
- Mute Topic
- Printer Friendly Page
- Mark as New
- Bookmark Message
- Subscribe to Message
- Mute Message
- Subscribe to RSS Feed
- Permalink
- Report Inappropriate Content
I have two questions.
Q1. About rt-alert and stats command
I created a real-time alert in my environment, but it does not work as I expected.
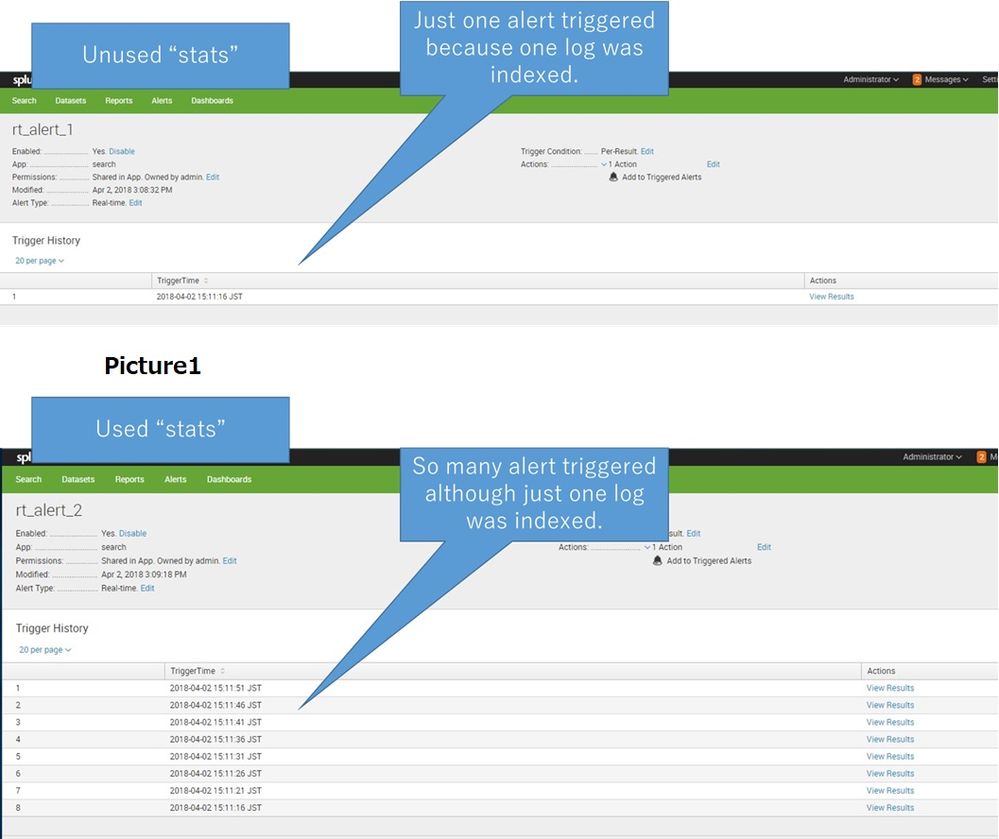
As a phenomenon, alerts are triggered in large quantities even though there is only one log to be detected for some reason.
After examining, the existence of the stats command seemed to cause this phenomenon.
So I created the following alerts 1 and 2.
Name : rt_alert_1
Alert type : Real-time
Trigger alert when : Per-Result
Throttle : false
SPL : index="rt_alert_test" | table tbyte rbyte

Name : rt_alert_2
Alert type : Real-time
Trigger alert when : Per-Result
Throttle : false
SPL : index="rt_alert_test" | stats max(tbyte) as max_tbyte | table max_tbyte
And I indexed a log like below.
2018/4/2 15:11:00 tbyte=10000 rbyte=10000
Then a large number of alerts were triggered in alert 2 at intervals of seconds, as with Picture 1.
I found this phenomenon in ver 6.6.6 and 7.0.1.
Is this specification? And I should not use stats in rt-alert?
Q2. About rt-alert and rolling-window-alert
I changed alert 1 and 2 to this.
 Name : rt_alert_1
 Alert type : Real-time
 Trigger alert when : Number of Results
 is greater than : 0
 in : 5 minutes
 Trigger : once
 Throttle : 60 seconds
 SPL : index="rt_alert_test" | table tbyte rbyte

 Name : rt_alert_2
 Alert type : Real-time
 Trigger alert when : Number of Results
 is greater than : 0
 in : 5 minutes
 Trigger : once
 Throttle : 60 seconds
 SPL : index="rt_alert_test" | stats max(tbyte) as max_tbyte | table max_tbyte
And I indexed a log like below.
2018/4/2 15:16:00 tbyte=10000 rbyte=10000
Then it seemed that both of alerts were triggered at 60 second intervals until the indexed log came out of the search range of the 5 minutes window.
Is the mechanism different between rt-alert and rolling-window-alert?
What kind of movement are these going to be?
I am very thankful if anyone can tell me.
- Mark as New
- Bookmark Message
- Subscribe to Message
- Mute Message
- Subscribe to RSS Feed
- Permalink
- Report Inappropriate Content
The following Answer mentioned the truth of this.
*Actually this is old information, but maybe moves of real-time search have not changed.
https://answers.splunk.com/answers/342271/alerts-triggering-continuously.html
- Mark as New
- Bookmark Message
- Subscribe to Message
- Mute Message
- Subscribe to RSS Feed
- Permalink
- Report Inappropriate Content
Could you please refer this document
it will explain with simple tabular column
http://docs.splunk.com/Documentation/Splunk/7.0.2/Alert/AlertTypesOverview
- Mark as New
- Bookmark Message
- Subscribe to Message
- Mute Message
- Subscribe to RSS Feed
- Permalink
- Report Inappropriate Content
Thank you for answer!
I understood like below, is this correct?
A real-time alert searches for a captured log and triggers an alert, so one alert is given for one log.
However, since rolling-window-alert invokes alert-action according to the number of events that meet the conditions within rolling-window, alert-action continues to be invoked as long as the number of events exceed the specified range within rolling-window.
The difference in this specification creates differences like the questions I did.
Also do you know differences of move between real-time alert using stats and not using stats?
- Mark as New
- Bookmark Message
- Subscribe to Message
- Mute Message
- Subscribe to RSS Feed
- Permalink
- Report Inappropriate Content
stats give the result in numbers.
in your first question: even for zero log, stats producing the result as no threshold present. it would take zero as value
in your second question:
1)it gave the events for 60 seconds
2) when using stats, it gave number for 60 seconds
let us know if still any clarification you need


