- Splunk Answers
- :
- Using Splunk
- :
- Dashboards & Visualizations
- :
- Visualization color issue
- Subscribe to RSS Feed
- Mark Topic as New
- Mark Topic as Read
- Float this Topic for Current User
- Bookmark Topic
- Subscribe to Topic
- Mute Topic
- Printer Friendly Page
- Mark as New
- Bookmark Message
- Subscribe to Message
- Mute Message
- Subscribe to RSS Feed
- Permalink
- Report Inappropriate Content
Hi All,
First of all the version of the splunk we have in our environment is as follows;
Splunk Version
6.2.3
Splunk Build
264376
i do have a single line single number visualization dashborad.the problem is when i run them indivually i get the color coding but when it is on saved dashboard,coloring does not work
here are my queries for both searches;
1) failed diu
Message="failed to execute"|search Message >0 |stats count(eval(Message="failed to execute")) AS "Failed DIU" |eval Value = 500| rangemap field=Value none=0-99 low=100-199 guarded=200-299 elevated=300-399 high=400-499 severe=500-599 default=none
and i get the set color of red when i click on visualiztion(red)
2) successful diu
Message="was executed successfully"|search Message >0|stats count(eval(Message="was executed successfully")) AS "Successful DIU" |eval Value = 0| rangemap field=Value none=0-99 low=100-199 guarded=200-299 elevated=300-399 high=400-499 severe=500-599 default=none
and i get the set color of black when i click on visualiztion
any idea why the colors do not work when saved as one dashboard.
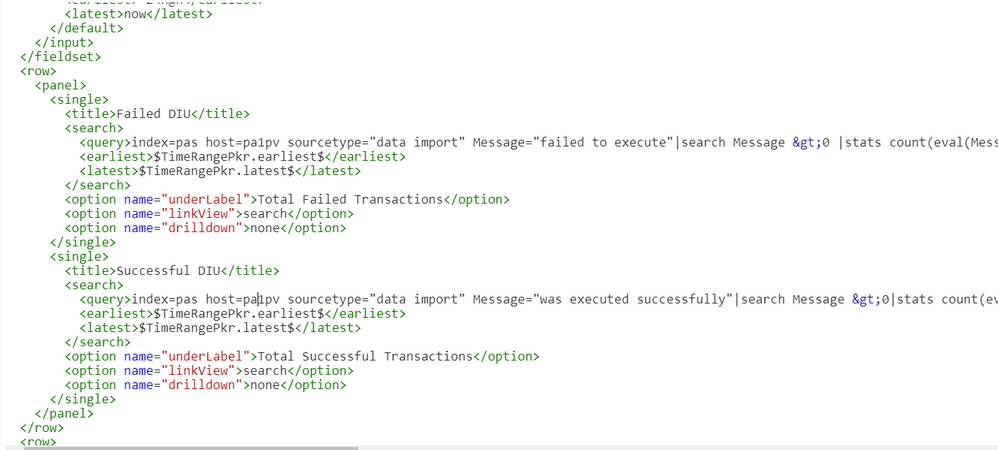
here is my source code as well if that helps
i have a test environment which the latest version of splunk is installed and all works as expected,but with different version i don't even have the UI option that i have on the latest version for coloring is not presented in 6.2 version
Thanks
- Mark as New
- Bookmark Message
- Subscribe to Message
- Mute Message
- Subscribe to RSS Feed
- Permalink
- Report Inappropriate Content
For 6.2.0, try adding this to the options for both panels
<option name="classField">range</option>
- Mark as New
- Bookmark Message
- Subscribe to Message
- Mute Message
- Subscribe to RSS Feed
- Permalink
- Report Inappropriate Content
For 6.2.0, try adding this to the options for both panels
<option name="classField">range</option>
- Mark as New
- Bookmark Message
- Subscribe to Message
- Mute Message
- Subscribe to RSS Feed
- Permalink
- Report Inappropriate Content
That did it.Thank you Renjith
- Mark as New
- Bookmark Message
- Subscribe to Message
- Mute Message
- Subscribe to RSS Feed
- Permalink
- Report Inappropriate Content
You can refer this app:
https://splunkbase.splunk.com/app/1603/


