- Splunk Answers
- :
- Splunk Administration
- :
- Monitoring Splunk
- :
- How can i improve Performance of tstats
- Subscribe to RSS Feed
- Mark Topic as New
- Mark Topic as Read
- Float this Topic for Current User
- Bookmark Topic
- Subscribe to Topic
- Mute Topic
- Printer Friendly Page
- Mark as New
- Bookmark Message
- Subscribe to Message
- Mute Message
- Subscribe to RSS Feed
- Permalink
- Report Inappropriate Content
Hi
I have the following queary using Tstats .. The issues is it take 22 seconds and i need 10.
In general i am looking for do and don't in the query and how do i improve the performance of it.
Any pointer would be great thanks. 🙂
| tstats summariesonly=true values(MXTIMING.Elapsed) AS Elapsed values(MXTIMING.CPU) AS CPU values(MXTIMING.CPU_PER) AS CPU_PER values(MXTIMING.Memory) AS Memory values(MXTIMING.Elapsed_C) AS Elapsed_C dc(source) AS source_file FROM datamodel=MXTIMING_V3 WHERE
    host=UBS-RC_QCST_MASTER
    AND MXTIMING.Elapsed > 5
    AND MXTIMING.source_path IN (*)
    AND MXTIMING.UserName2 IN (*)
    AND MXTIMING.NPID IN (*)
    AND MXTIMING.MXTIMING_TYPE_DM IN (LIVEBOOK)
    AND MXTIMING.Context+Command IN (*#*)
    AND MXTIMING.Context+Command IN (*#*)
    AND MXTIMING.Time = *
    GROUPBY MXTIMING.Context+Command MXTIMING.NPID MXTIMING.Time MXTIMING.MXTIMING_TYPE_DM
- Mark as New
- Bookmark Message
- Subscribe to Message
- Mute Message
- Subscribe to RSS Feed
- Permalink
- Report Inappropriate Content
So in the end what i did to scan over 200 Million lines is i created different data-model pending on there values.
So for example i am after greater then 5 seconds as a value in the datamodel - so i set up a "CONSTRAINTS".
So data model 1 is less then 5 seconds and data-model 2 is greater then 5 seconds.
When the users opens the dashboard it default to greater then 5 seconds.
This cuts down the no of results to 200K, it is much quicker now.
- Mark as New
- Bookmark Message
- Subscribe to Message
- Mute Message
- Subscribe to RSS Feed
- Permalink
- Report Inappropriate Content
It looks like you're trying to track metrics - have you considered using the metrics store, and querying metrics with mstats? It's supposed to be much faster for metrics-type data.
That being said, tstats performance is a cross of data model acceleration size, type of filters and fields used, cardinality of fields especially in the groupby part, number of indexers, IO performance of indexers, number of buckets touched, and possibly more.
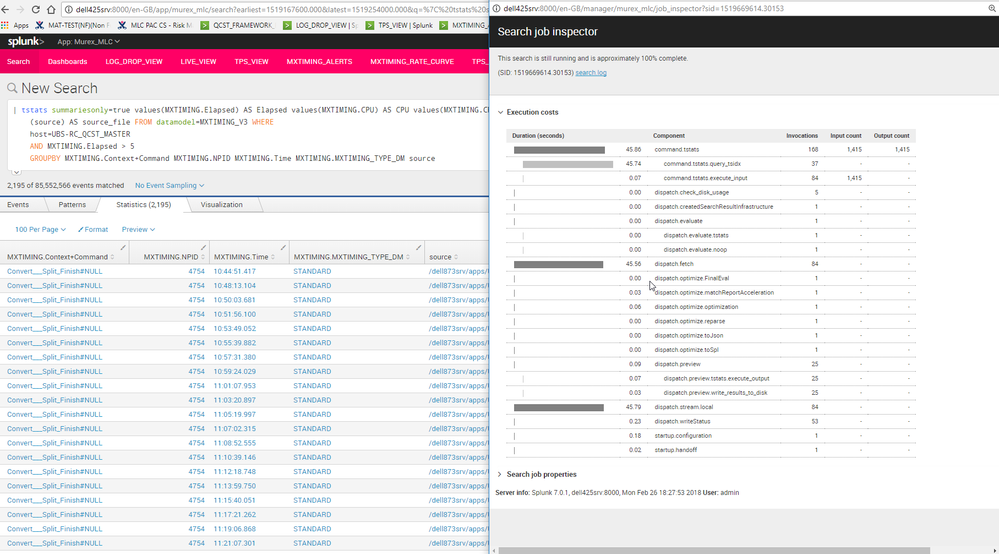
Without knowing your data model or the job inspector results of the tstats search it's hard to pinpoint the exact issue in your case, Do post your job inspector at least.
I'd start with the values() aggregations. Are you really looking for a dedup'd set of all values, or for just one value? If so, consider using first() instead.
Then I see you have a field MXTIMING.Time - any reason why you're not using the built-in _time field? Also, you're grouping by that time field, usually you'll want to specify a span of _time to reduce cardinality of almost-but-not-quite-the-same timestamps.
What's the reason for all those field IN (*)? That should make splunk touch lots of columns in the tsidx for no apparent reason.
- Mark as New
- Bookmark Message
- Subscribe to Message
- Mute Message
- Subscribe to RSS Feed
- Permalink
- Report Inappropriate Content
HI
Thanks for your help, i go some great ideas form what you said. I have improved the search and re-run.
Just uploaded image of job inspector. I will write a full answer in the next hour or so
- Mark as New
- Bookmark Message
- Subscribe to Message
- Mute Message
- Subscribe to RSS Feed
- Permalink
- Report Inappropriate Content
So. I am trying to scan infor over 200 Million lines in a datamodel. I have one search head and one indexer. Not sure if increase these will improve my performance for my search.
I have taken you good advice and removed fields that are not needed. However it is still slow so not sure if there is anything else i can do here?
- Mark as New
- Bookmark Message
- Subscribe to Message
- Mute Message
- Subscribe to RSS Feed
- Permalink
- Report Inappropriate Content
Just to add i have a 58 core high powered box ready to be used for this. So i have the cpu power, just not sure what can be increased?

