- Splunk Answers
- :
- Splunk Premium Solutions
- :
- IT Ops Premium Solutions
- :
- Splunk IT Service Intelligence
- :
- How can I get the failure count value in Glass tab...
- Subscribe to RSS Feed
- Mark Topic as New
- Mark Topic as Read
- Float this Topic for Current User
- Bookmark Topic
- Subscribe to Topic
- Mute Topic
- Printer Friendly Page
- Mark as New
- Bookmark Message
- Subscribe to Message
- Mute Message
- Subscribe to RSS Feed
- Permalink
- Report Inappropriate Content
How can I get the failure count value in Glass table?
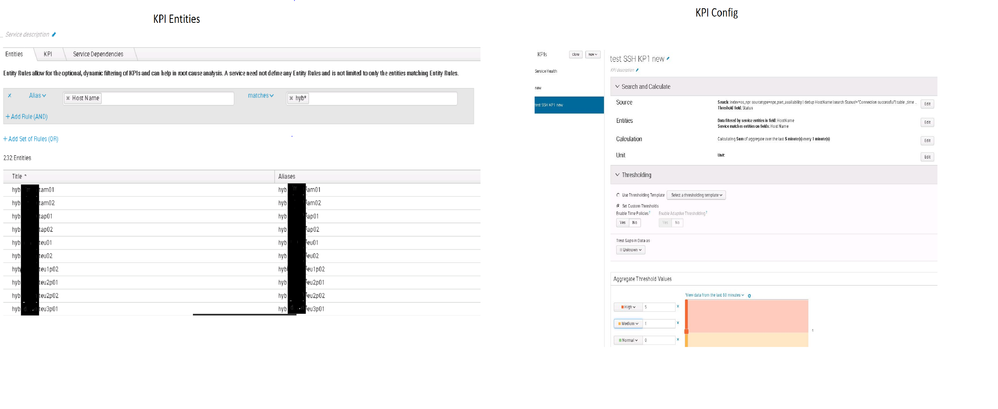
I have created one base search and multiple services with entities and also created KPI using the base search.
I try to drag the KPI to glass table to get a count of particular service. In search, I get the alert value as 6 but in glass table, it shows as 0 or 10(sum of errors of all servers).
The same search is working if add a ad-hoc search in service.
Base search
index=os sourcetype=port_availability | dedup HostName |search Status!="Connection successful"| table _time HostName port Status| eval Priority="P3"
PFA screenshots for your reference,

- Mark as New
- Bookmark Message
- Subscribe to Message
- Mute Message
- Subscribe to RSS Feed
- Permalink
- Report Inappropriate Content
You should open your KPI search and expand the macro out cmd + shift + e . Then strip everything off below the first stats command and see what it's using to create the search. You are most likely not summing the value
- Mark as New
- Bookmark Message
- Subscribe to Message
- Mute Message
- Subscribe to RSS Feed
- Permalink
- Report Inappropriate Content
In KPI search it showing the correct value. But not in glass table.
Also there is no option for count in Service/Aggregate calculation.


