Turn on suggestions
Auto-suggest helps you quickly narrow down your search results by suggesting possible matches as you type.
Showing results for
All Apps and Add-ons
Turn on suggestions
Auto-suggest helps you quickly narrow down your search results by suggesting possible matches as you type.
Showing results for
- Apps and Add-ons
- :
- All Apps and Add-ons
- :
- Convert query results to line chart
Options
- Subscribe to RSS Feed
- Mark Topic as New
- Mark Topic as Read
- Float this Topic for Current User
- Bookmark Topic
- Subscribe to Topic
- Mute Topic
- Printer Friendly Page
- Mark as New
- Bookmark Message
- Subscribe to Message
- Mute Message
- Subscribe to RSS Feed
- Permalink
- Report Inappropriate Content
karthi25
Path Finder
01-22-2018
01:01 AM
I have an oracle query as follows:
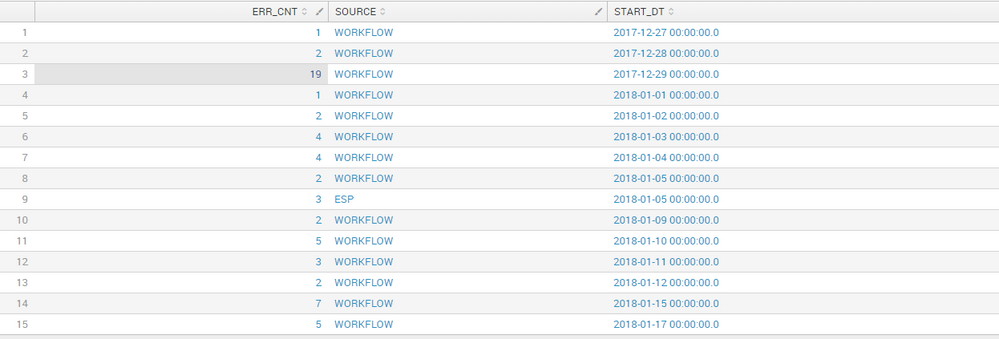
|dbxquery query="select trunc(start_dt) START_DT, count(0) ERR_CNT , 'WORKFLOW' as SOURCE from ***.WORKFLOW_LOG wl where WL.STATUS not in ('COMPLETED', 'INPROGRESS') and start_dt > SYSDATE - 30 group by trunc(start_dt) union select trunc(create_dt) START_DT, count(0) ERR_CNT , 'ESP' as SOURCE from ***.event_error_records eer where create_dt > SYSDATE - 30 group by trunc(create_dt)" connection="ABC_DADPP1"
And, the above query will produces the result below:
Now, I want to format the date and to create the the chart as below:
Can anyone please help to do it.
1 Solution
- Mark as New
- Bookmark Message
- Subscribe to Message
- Mute Message
- Subscribe to RSS Feed
- Permalink
- Report Inappropriate Content
mayurr98
Super Champion
01-22-2018
01:24 AM
you can try something like this
| dbxquery query="select trunc(start_dt) START_DT, count(0) ERR_CNT , 'WORKFLOW' as SOURCE from ***.WORKFLOW_LOG wl where WL.STATUS not in ('COMPLETED', 'INPROGRESS') and start_dt > SYSDATE - 30 group by trunc(start_dt) union select trunc(create_dt) START_DT, count(0) ERR_CNT , 'ESP' as SOURCE from ***.event_error_records eer where create_dt > SYSDATE - 30 group by trunc(create_dt)" connection="ABC_DADPP1"
| eval newtime=strptime(START_DT,"%Y-%m-%d %H:%M:%S") | eval _time=newtime
| timechart span=2d sum(ERR_CNT) by SOURCE
OR try this which is specific to your requirement
| dbxquery query="select trunc(start_dt) START_DT, count(0) ERR_CNT , 'WORKFLOW' as SOURCE from ***.WORKFLOW_LOG wl where WL.STATUS not in ('COMPLETED', 'INPROGRESS') and start_dt > SYSDATE - 30 group by trunc(start_dt) union select trunc(create_dt) START_DT, count(0) ERR_CNT , 'ESP' as SOURCE from ***.event_error_records eer where create_dt > SYSDATE - 30 group by trunc(create_dt)" connection="ABC_DADPP1"
| eval newtime=strptime(START_DT,"%Y-%m-%d %H:%M:%S") | eval _time=newtime
| timechart span=2d sum(ERR_CNT) by SOURCE
| rename _time as time
| eval time=strftime(time,"%m-%d")
let me know if this helps!
- Mark as New
- Bookmark Message
- Subscribe to Message
- Mute Message
- Subscribe to RSS Feed
- Permalink
- Report Inappropriate Content
FrankVl
Ultra Champion
01-22-2018
01:07 AM
Can you show what the output of the query looks like? Without that info it is rather hard to say what commands to use to transform it into something that can be visualized as a line chart.
- Mark as New
- Bookmark Message
- Subscribe to Message
- Mute Message
- Subscribe to RSS Feed
- Permalink
- Report Inappropriate Content
karthi25
Path Finder
01-22-2018
01:16 AM
I have edited it.. 🙂
Get Updates on the Splunk Community!
Introducing the 2024 SplunkTrust!
Hello, Splunk Community! We are beyond thrilled to announce our newest group of SplunkTrust members!
The ...
Introducing the 2024 Splunk MVPs!
We are excited to announce the 2024 cohort of the Splunk MVP program. Splunk MVPs are passionate members of ...
Splunk Custom Visualizations App End of Life
The Splunk Custom Visualizations apps End of Life for SimpleXML will reach end of support on Dec 21, 2024, ...


