Turn on suggestions
Auto-suggest helps you quickly narrow down your search results by suggesting possible matches as you type.
Showing results for
Dashboards & Visualizations
Turn on suggestions
Auto-suggest helps you quickly narrow down your search results by suggesting possible matches as you type.
Showing results for
- Splunk Answers
- :
- Using Splunk
- :
- Dashboards & Visualizations
- :
- How to display the difference between two columns ...
Options
- Subscribe to RSS Feed
- Mark Topic as New
- Mark Topic as Read
- Float this Topic for Current User
- Bookmark Topic
- Subscribe to Topic
- Mute Topic
- Printer Friendly Page
- Mark as New
- Bookmark Message
- Subscribe to Message
- Mute Message
- Subscribe to RSS Feed
- Permalink
- Report Inappropriate Content
How to display the difference between two columns as a single value ,along with showing arrow of difference without using timechart?
KASKIRANA1122
New Member
12-05-2017
07:57 PM
I have this query
|inputlookup test | search Feed=win|stats dc(ServerName) as ExpectedCount|appendcols[ search index=win earliest=-1d@d latest=-0d@h
| stats dc(host) as Currentcount ]|eval delta=ExpectedCount-Currentcount
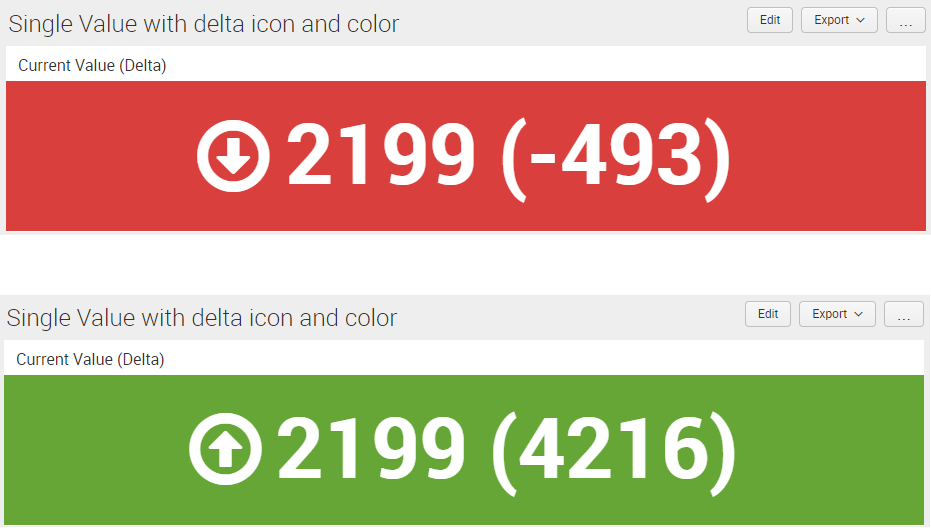
Now I want to display the current count as single value along with delta in red/green with arrow
Can you please help
- Mark as New
- Bookmark Message
- Subscribe to Message
- Mute Message
- Subscribe to RSS Feed
- Permalink
- Report Inappropriate Content
diptendu
New Member
12-06-2017
06:01 AM
how can the query be changed so that the xml need not be written, how to use the timechart command to dispaly the difference.
- Mark as New
- Bookmark Message
- Subscribe to Message
- Mute Message
- Subscribe to RSS Feed
- Permalink
- Report Inappropriate Content
niketn
Legend
12-06-2017
02:32 AM
@KASKIRANA1122, what you are requesting seems to be a candidate for Splunk Status Indicator Custom Visualization.
Please see below a run anywhere dashboard which shows icon color based on Delta and also Current Value.
Following is the complete Simple XML:
<dashboard>
  <label>Single Value with delta icon and color</label>
  <search>
    <query>| makeresults
| fields - _time
| eval ExpectedCount=substr("".random(),0,4)
| appendcols [search index=_internal sourcetype=splunkd log_level!=INFO earliest=-1d@d latest=-0d@h
| stats count as Currentcount]
| eval delta=ExpectedCount-Currentcount</query>
    <sampleRatio>1</sampleRatio>
    <done>
      <condition match="$job.resultCount$==0">
        <set token="tokCurrentCount">0</set>
        <eval token="tokDelta">$result.delta$</eval>
      </condition>
      <condition>
        <set token="tokCurrentCount">$result.Currentcount$</set>
        <eval token="tokDelta">$result.delta$</eval>
      </condition>
    </done>
  </search>
  <row>
    <panel>
      <title>Current Value (Delta)</title>
      <viz type="status_indicator_app.status_indicator">
        <search>
          <query>| makeresults
            | eval display="$tokCurrentCount$ ($tokDelta$)"
            | eval icon=if($tokDelta$>=0,"arrow-circle-o-up","arrow-circle-o-down")
            | eval color=if($tokDelta$>=0,"#65a637","#d93f3c")
            | table display icon color
          </query>
        </search>
        <option name="height">150</option>
        <option name="status_indicator_app.status_indicator.colorBy">field_value</option>
        <option name="status_indicator_app.status_indicator.fillTarget">background</option>
        <option name="status_indicator_app.status_indicator.fixIcon">warning</option>
        <option name="status_indicator_app.status_indicator.icon">field_value</option>
        <option name="status_indicator_app.status_indicator.precision">0</option>
        <option name="status_indicator_app.status_indicator.showOption">1</option>
        <option name="status_indicator_app.status_indicator.staticColor">#555</option>
        <option name="status_indicator_app.status_indicator.useColors">true</option>
        <option name="status_indicator_app.status_indicator.useThousandSeparator">true</option>
      </viz>
    </panel>
  </row>
</dashboard>
____________________________________________
| makeresults | eval message= "Happy Splunking!!!"
| makeresults | eval message= "Happy Splunking!!!"
Get Updates on the Splunk Community!
Adoption of RUM and APM at Splunk
Unleash the power of Splunk Observability
Watch Now
In this can't miss Tech Talk! The Splunk Growth ...
Routing logs with Splunk OTel Collector for Kubernetes
The Splunk Distribution of the OpenTelemetry (OTel) Collector is a product that provides a way to ingest ...
Welcome to the Splunk Community!
(view in My Videos)
We're so glad you're here!
The Splunk Community is place to connect, learn, give back, and ...

