Monitoring Splunk

Why are the queues being filled up on one indexer?

ddrillic
Ultra Champion

In the last day or two all the queues of one indexer got filled up. We bounced it and now on another indexer all the queues are close to 100%. What can it be?

alt text

ddrillic
Ultra Champion

Normally, for months and months at this point of the day all the queues would be quite empty. However, h2709 is still pretty bad -

![alt text

I took h2709out of the forwarders rotation (for the most part) and it took around 25 minutes to clear all queues.

alt text

0 Karma

ddrillic
Ultra Champion

After 25 minutes, h2709 queues are fine...

0 Karma

ddrillic
Ultra Champion

Now all the traffic seems to go to another server h8788 -

alt text

0 Karma

ddrillic
Ultra Champion

The binding with h8788 remained throughout the night and this server already processed 1/2 TB of data.

0 Karma

ddrillic
Ultra Champion

Thank you @mwirth for working with us !!! So, one forwarder sends to us huge amounts of Hadoop/Flume data and just yesterday we received 1 TB of data from this forwarder.

We end up with a forwarder-indexer bound. How can we avoid it?

0 Karma

mwirth_splunk
Splunk Employee
Splunk Employee

Usually there's 3 things that block up queues;

  1. Input volume
  2. Performance
  3. Configuration

In this case, it's pretty clear the indexer in question is getting 2x the instantaneous indexing rate of the other indexers. My question is; is this server usually that much higher than the others?

0 Karma

ddrillic
Ultra Champion

Please keep in mind that the issue is now with h2709 but in the past 24 hours it was with h8789 until we bounced it and then it flipped to h2709.

Let me check the indexing rates...

Looking now and the indexing rate of h2709 is much lower but its queues are almost filled up -

alt text

0 Karma

mwirth_splunk
Splunk Employee
Splunk Employee

Okay, so that means that the forwarder(s) in question are successfully sending to multiple indexers, that's great!

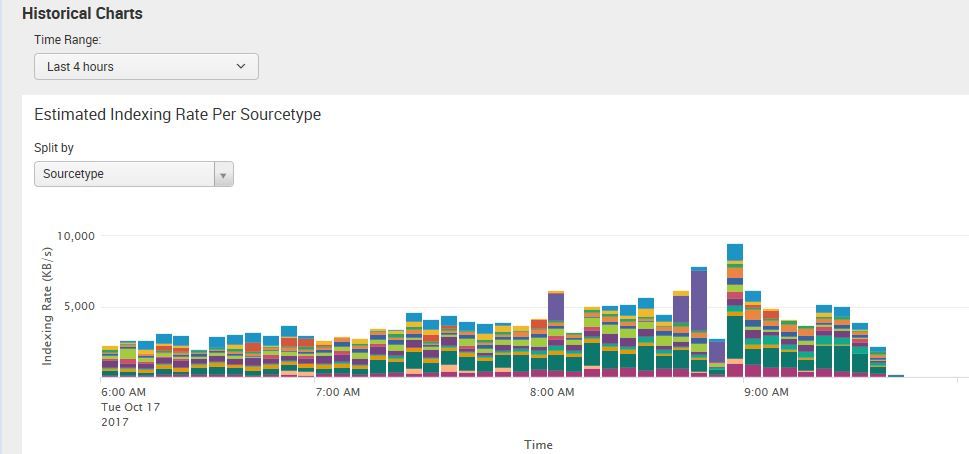
Now we need to find out what datasource is causing that indexing bandwidth. Go to the monitoring console and open the "Indexing Performance: Instance" dashboard. Scroll down to the "Estimated Indexing Rate Per Sourcetype" panel and see if there are any outliers.

EDIT:
That feast/famine cycle (Where an instance has an enormous indexing rate with full queues then drops to nearly none) is just the data load balancing to another server and the queues emptying to disk after backing up. Very normal in this circumstance.

0 Karma

ddrillic
Ultra Champion

That's what we see for h2709 -

alt text

0 Karma

mwirth_splunk
Splunk Employee
Splunk Employee

Dark purple and dark green look like likely suspects, take note of those sourcetypes. Can you confirm the same spike in indexing load from those sourcetypes on other hosts during the time window when they had issues?

This is normally going to happen because of a single forwarder sending a very high amount of bandwidth. It can be addressed in a couple of different ways-
1. Increase the number of threads on the forwarder, since each thread can send to a distinct indexer.
2. If the data is coming from a centralized data source (like syslog etc) spread the load out between hosts.

For some perspective, 6MB/s over a 24h period would result in over 500GB/day, which is well outside the recommended 200-250GB/day per indexer. No wonder the poor servers are struggling!

0 Karma
Get Updates on the Splunk Community!

Routing logs with Splunk OTel Collector for Kubernetes

The Splunk Distribution of the OpenTelemetry (OTel) Collector is a product that provides a way to ingest ...

Welcome to the Splunk Community!

(view in My Videos) We're so glad you're here! The Splunk Community is place to connect, learn, give back, and ...

Tech Talk | Elevating Digital Service Excellence: The Synergy of Splunk RUM & APM

Elevating Digital Service Excellence: The Synergy of Real User Monitoring and Application Performance ...