- Splunk Answers
- :
- Using Splunk
- :
- Splunk Search
- :
- Displaying a marker for each event
- Subscribe to RSS Feed
- Mark Topic as New
- Mark Topic as Read
- Float this Topic for Current User
- Bookmark Topic
- Subscribe to Topic
- Mute Topic
- Printer Friendly Page
- Mark as New
- Bookmark Message
- Subscribe to Message
- Mute Message
- Subscribe to RSS Feed
- Permalink
- Report Inappropriate Content
Displaying a marker for each event
I'm trying to display markers on a map using Splunk. I'm currently trying out geostats but i don't seem to get it working.
The latitude is stored as DevEUI_location.DevLAT and longitude as DevEUI_location.DevLON.
I have tried the following:
host=jan DevEUI_location | geostats latfield=DevEUI_location.DevLAT longfield=DevEUI_location.DevLON --> Displays nothing on map
host=jan DevEUI_location | geostats latfield=DevEUI_location.DevLAT longfield=DevEUI_location.DevLON count --> Displays 1 big circle
I would like a marker or indicator for each event. Any idea how to do this?
Thanks
- Mark as New
- Bookmark Message
- Subscribe to Message
- Mute Message
- Subscribe to RSS Feed
- Permalink
- Report Inappropriate Content
Looks like this may be your answer.
https://answers.splunk.com/answers/113295/plotting-points-on-a-splunk-6-map.html
- Mark as New
- Bookmark Message
- Subscribe to Message
- Mute Message
- Subscribe to RSS Feed
- Permalink
- Report Inappropriate Content
Thanks @DalJeanis,
Using the following search:
host=jan DevEUI_location | geostats latfield=DevEUI_location.DevLAT longfield=DevEUI_location.DevLON binspanlat=0.1 binspanlong=0.1 count
I got this result:
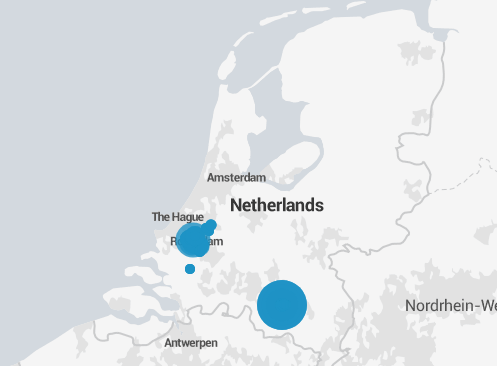
This may not be exactly what I was looking for but it will do. It would be better if I could zoom in further. I have tried setting maxzoomlevel but I think the above is the max zoom in.
Thanks for your help!
- Mark as New
- Bookmark Message
- Subscribe to Message
- Mute Message
- Subscribe to RSS Feed
- Permalink
- Report Inappropriate Content
@jankappe - if your issue has been solved, please accept the answer so the question will show as resolved.
- Mark as New
- Bookmark Message
- Subscribe to Message
- Mute Message
- Subscribe to RSS Feed
- Permalink
- Report Inappropriate Content
Not knowing what else you are trying to do, this streamstats code assigns a unique recno to each event and asks to have each plotted distinctly on the map.
host=jan DevEUI_location
| streamstats count as recno
| geostats latfield=DevEUI_location.DevLAT longfield=DevEUI_location.DevLON count by recno
- Mark as New
- Bookmark Message
- Subscribe to Message
- Mute Message
- Subscribe to RSS Feed
- Permalink
- Report Inappropriate Content
Thanks for your answer. When running this code i get one pie chart like this:
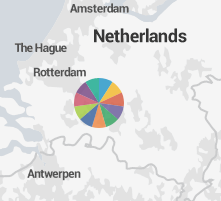
i would like a marker or circle for each event.
- Mark as New
- Bookmark Message
- Subscribe to Message
- Mute Message
- Subscribe to RSS Feed
- Permalink
- Report Inappropriate Content
Converting to comment so someone else may take a look. Looks like geostats is going to bin up the various recnos based on locale, so this strategy doesn't help you at all.
More Control Over Your Monitoring Costs with Archived Metrics!
New in Observability Cloud - Explicit Bucket Histograms
Updated Team Landing Page in Splunk Observability
