- Splunk Answers
- :
- Splunk Administration
- :
- Deployment Architecture
- :
- Help with a DevOps deployment: Why am I receiving ...
- Subscribe to RSS Feed
- Mark Topic as New
- Mark Topic as Read
- Float this Topic for Current User
- Bookmark Topic
- Subscribe to Topic
- Mute Topic
- Printer Friendly Page
- Mark as New
- Bookmark Message
- Subscribe to Message
- Mute Message
- Subscribe to RSS Feed
- Permalink
- Report Inappropriate Content
Hi All,
Really need a Jedi to help me get my DevOps instance running again.
I have a security appliance sending logs to Splunk (on a Linux server).
The indexer and search head are also on the same server.
There is an app (for the security appliance) on the search head.
Nothing other than the sec appliance logs are being sent to it.
This setup was working great for weeks as we created reports and (only) two scheduled alerts.
Currently, everything has been restarted, the server, Splunk, etc... but when I log in it just hangs and "waiting for data" is displayed on the search screen.
The Health checks are all good, license is good, resource are good... but search is waiting for input....
FW rules confirmed good
I can search for _* (e.g. audit...) and I get results for all indexes except main!
When I looked in main, no events were present, when I test fire the sec appliance everything works now.
So what could have caused all events to be cleaned out or dropped from main?
The following alert is occurring and we are currently not losing historic data, however does anyone know how to troubleshoot the following issue?
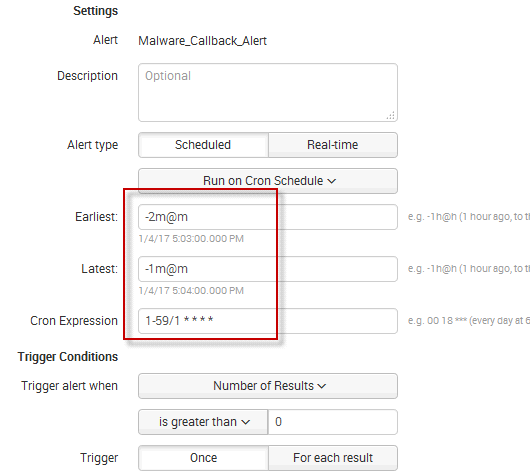
I only have 2 alerts running, both scheduled the same (could that be the problem?)
any ideas?
This one remains a mystery and so I created a separate question for the errors, I will close this one.
Thank you
- Mark as New
- Bookmark Message
- Subscribe to Message
- Mute Message
- Subscribe to RSS Feed
- Permalink
- Report Inappropriate Content
The data loss (loss of historical logs) is still TBD. I created a new question regarding the errors if anyone has any pointers. Thank you everyone for your replies.
- Mark as New
- Bookmark Message
- Subscribe to Message
- Mute Message
- Subscribe to RSS Feed
- Permalink
- Report Inappropriate Content
Also, depending on your dashboard, you may have surround the variable with 2 $$ instead of one
like this
$$variablename$$
- Mark as New
- Bookmark Message
- Subscribe to Message
- Mute Message
- Subscribe to RSS Feed
- Permalink
- Report Inappropriate Content
This is generally caused by an unresolved token in your search string. You probably are using a dashboard or a macro that has a token (argument) defined that is not being set. Look in your search for a $SomeField$ token (field name surrounded by dollar-signs). One of these is not being set for some reason. I do not think that this is caused by a lack of data in the searched indexed because this will result in a different string (i.e. not "waiting for data").
- Mark as New
- Bookmark Message
- Subscribe to Message
- Mute Message
- Subscribe to RSS Feed
- Permalink
- Report Inappropriate Content
Thank you for the reply, we are still investigating. However we are not using a dashboard, just two manually run reports in Search. Then I created two scheduled alerts from the reports. I guess we are not really using the Sec-Appliance App. The real question is where did all the historical data go?


