- Splunk Answers
- :
- Using Splunk
- :
- Dashboards & Visualizations
- :
- Random Sparklines not showing/rendering
- Subscribe to RSS Feed
- Mark Topic as New
- Mark Topic as Read
- Float this Topic for Current User
- Bookmark Topic
- Subscribe to Topic
- Mute Topic
- Printer Friendly Page
- Mark as New
- Bookmark Message
- Subscribe to Message
- Mute Message
- Subscribe to RSS Feed
- Permalink
- Report Inappropriate Content
Random Sparklines not showing/rendering
Hi,
I have the below dashboard and it mostly works. The odd thing is random sparklines simply don't render. If you hover over them the values show up but the bars never do. If you refresh the dashboard, some of the ones that were blank before the refresh will show but others are now blank. This happens most often in the last sparkline column "Trend Disk" as shown on the screenshots attached. Has anyone seen this before?
<dashboard refresh="300">
  <label>test1</label>
  <row>
    <panel>
      <table>
        <search>
          <query>index=os sourcetype=vmstat OR sourcetype=cpu OR sourcetype=df host=beta* |eventstats avg(cpu_load_percent) as avgcpu avg(memUsedPct) as avgmemory avg(processes) as avgproc by host|eval avgcpu=round(avgcpu,2)|eval avgmemory=round(avgmemory,2)|eval avgproc=round(avgproc,0)|stats sparkline(max(cpu_load_percent)) as "Trend CPU" last(cpu_load_percent) as "Current CPU" values(avgcpu) as "Avg CPU" max(cpu_load_percent) as "Max % CPU" sparkline(avg(memUsedPct)) as "Trend Memory" last(memUsedPct) as "Current MEM" values(avgmemory) as "Avg MEM" max(memUsedPct) as "Max MEM" sparkline(avg(processes)) as "Trend Processes" last(processes) as "Current PROC" values(avgproc) as "Avg PROC" max(processes) as "Max PROC" sparkline(max(storage_used_percent)) as "Trend Disk" max(storage_used_percent) as "Current DISK" by host|rename host as "Host - Click for Detail"</query>
          <earliest>-4h@m</earliest>
          <latest>now</latest>
        </search>
        <format type="sparkline" field="Trend CPU">
          <option name="type">bar</option>
          <option name="height">20px</option>
          <!-- Use colorMap to map specific values to selected colors -->
          <option name="colorMap">
            <option name="0:69">#008744</option>
            <option name="70:79">#ffa700</option>
            <option name="80:">#f00000</option>
          </option>
          <option name="barWidth">1px</option>
        </format>
        <format type="sparkline" field="Trend Memory">
          <option name="type">bar</option>
          <option name="height">20px</option>
          <!-- Use colorMap to map specific values to selected colors -->
          <option name="colorMap">
            <option name="0:69">#008744</option>
            <option name="70:79">#ffa700</option>
            <option name="80:">#f00000</option>
          </option>
          <option name="barWidth">1px</option>
        </format>
        <format type="sparkline" field="Trend Disk">
          <option name="type">bar</option>
          <option name="height">20px</option>
          <!-- Use colorMap to map specific values to selected colors -->
          <option name="colorMap">
            <option name="0:69">#008744</option>
            <option name="70:79">#ffa700</option>
            <option name="80:">#f00000</option>
          </option>
          <option name="barWidth">1px</option>
        </format>
        <format type="sparkline" field="Trend Processes">
          <option name="type">bar</option>
          <option name="height">20px</option>
          <option name="barWidth">1px</option>
          <!-- Use colorMap to map specific values to selected colors -->
          <option name="colorMap">
            <option name="0:299">#008744</option>
            <option name="300:399">#ffa700</option>
            <option name="400:">#f00000</option>
          </option>
        </format>
        <option name="wrap">true</option>
        <option name="rowNumbers">false</option>
        <option name="dataOverlayMode">none</option>
        <option name="drilldown">cell</option>
        <option name="count">25</option>

      </table>
    </panel>
  </row>
</dashboard>
- Mark as New
- Bookmark Message
- Subscribe to Message
- Mute Message
- Subscribe to RSS Feed
- Permalink
- Report Inappropriate Content
I am having a similar issue - sparkline bars are randomly on the floor or at the top, all showing the same value.
Doing some research, I've narrowed it down to the insertion of tokens connecting to the common time picker. If the earliest/latest xml tags are static values, it renders the bars as expected. If it's using time picker values, even with the exact time as specified in the static version of earliest/latest, the bars become unpredictable.
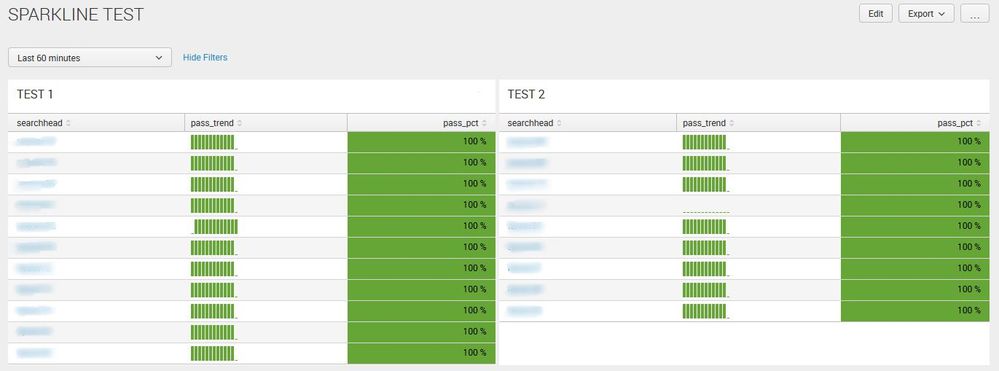
Here's an example, a simple 5-minute interval check of search head status. Sparkline is set to 5m bins, so bars are either going to be a 1 or 0. In both charts shown, each bar is a "1" but the chart TEST 1 (static time) renders consistent bars. The chart TEST 2 (using picker, set to same time) renders with some odd ones. It might be one weird sparkline, it might be all of them, very random. I have reversed the time source and the rendering inconsistency follows the shared time picker tokens.
Here is the XML behind the scenes:
<form refresh="60">
  <label>SPARKLINE TEST</label>
  <fieldset submitButton="false">
    <input type="time" token="field1">
      <label></label>
      <default>
        <earliest>-1h</earliest>
        <latest>now</latest>
      </default>
    </input>
  </fieldset>
  <row>
    <panel>
      <title>TEST 1</title>
      <table>
        <search>
          <query>index=capacity_metrics source=d:\\log\\sh_*_avail.log sh_pool="adhoc"
| stats count(status) as test_ct, count(eval(status="pass")) as pass_ct, sparkline(count(eval(status="pass")), 5m) as pass_trend by searchhead,target_url
| eval pass_pct=round((pass_ct/test_ct)*100,1)
| table searchhead, pass_trend,pass_pct,target_url</query>
          <earliest>-60m</earliest>
          <latest>now</latest>
          <sampleRatio>1</sampleRatio>
        </search>
        <fields>["searchhead","pass_trend","pass_pct"]</fields>
        <option name="count">20</option>
        <option name="dataOverlayMode">none</option>
        <option name="drilldown">cell</option>
        <option name="percentagesRow">false</option>
        <format type="color" field="pass_pct">
          <colorPalette type="list">[#D93F3C,#F7BC38,#65A637]</colorPalette>
          <scale type="threshold">70,90</scale>
        </format>
        <format type="number" field="pass_pct">
          <option name="precision">0</option>
          <option name="unit">%</option>
        </format>
        <format field="pass_trend" type="sparkline">
          <option name="type">bar</option>
          <option name="height">20px</option>
          <option name="colorMap">
            <option name="0:69">#65A637</option>
            <option name="70:89">#F7BC38</option>
            <option name="70:89">#D93F3C</option>
          </option>
        </format>
        <drilldown>
          <eval token="url_token">replace($row.target_url$, "https://", ""</eval>
          <link target="_blank">https://$url_token|n$</link>
        </drilldown>
      </table>
    </panel>
    <panel>
      <title>TEST 2</title>
      <table>
        <search>
          <query>index=capacity_metrics source=d:\\log\\sh_*_avail.log sh_pool="scheduled"
| stats count(status) as test_ct, count(eval(status="pass")) as pass_ct, sparkline(count(eval(status="pass")), 5m) as pass_trend by searchhead,target_url
| eval pass_pct=round((pass_ct/test_ct)*100,1)
| table searchhead, pass_trend,pass_pct,target_url</query>
          <earliest>$field1.earliest$</earliest>
          <latest>$field1.latest$</latest>
          <sampleRatio>1</sampleRatio>
        </search>
        <fields>["searchhead","pass_trend","pass_pct"]</fields>
        <option name="count">20</option>
        <option name="dataOverlayMode">none</option>
        <option name="drilldown">cell</option>
        <option name="percentagesRow">false</option>
        <format type="color" field="pass_pct">
          <colorPalette type="list">[#D93F3C,#F7BC38,#65A637]</colorPalette>
          <scale type="threshold">70,90</scale>
        </format>
        <format type="number" field="pass_pct">
          <option name="precision">0</option>
          <option name="unit">%</option>
        </format>
        <format field="pass_trend" type="sparkline">
          <option name="type">bar</option>
          <option name="height">20px</option>
          <option name="colorMap">
            <option name="0:69">#65A637</option>
            <option name="70:89">#F7BC38</option>
            <option name="70:89">#D93F3C</option>
          </option>
        </format>
        <drilldown>
          <eval token="url_token">replace($row.target_url$, "https://", ""</eval>
          <link target="_blank">https://$url_token|n$</link>
        </drilldown>
      </table>
    </panel>
  </row>
</form>
Anyone else seeing this behavior? Any workaround to get good time picker results?
Thanks
- Mark as New
- Bookmark Message
- Subscribe to Message
- Mute Message
- Subscribe to RSS Feed
- Permalink
- Report Inappropriate Content
A little late to answer your question, but the sparklines are rendering -- it's just that it's setting the min value to whatever the data's value is, which in this case is a a constant -- so it 'draws' a null straight line.
Try adding something like this to the XML:
<option name="chartRangeMin">0</option>
- Mark as New
- Bookmark Message
- Subscribe to Message
- Mute Message
- Subscribe to RSS Feed
- Permalink
- Report Inappropriate Content
It appears to be affecting sparklines that have a consistent value. I.e. if the value for disk % used is 14 percent and remains 14% over the time period then the sparkline tends not to show/render/update
- Mark as New
- Bookmark Message
- Subscribe to Message
- Mute Message
- Subscribe to RSS Feed
- Permalink
- Report Inappropriate Content
Also, this problem does not appear if you are using line as the sparkline. If you use bar the problem re-appears.


