- Splunk Answers
- :
- Splunk Administration
- :
- Getting Data In
- :
- How To Alert if SourceType is Not Logging?
- Subscribe to RSS Feed
- Mark Topic as New
- Mark Topic as Read
- Float this Topic for Current User
- Bookmark Topic
- Subscribe to Topic
- Mute Topic
- Printer Friendly Page
- Mark as New
- Bookmark Message
- Subscribe to Message
- Mute Message
- Subscribe to RSS Feed
- Permalink
- Report Inappropriate Content
I have a forwarder which is configured to monitor 5 directories. Each directory has it's own sourcetype and one of them recently stopped logging. I want to create an alert if a sourcetype is not being indexed in the past 10 minutes, how can I do that?
- Mark as New
- Bookmark Message
- Subscribe to Message
- Mute Message
- Subscribe to RSS Feed
- Permalink
- Report Inappropriate Content
I don't know if its the best way to do it, but I run a simple search against the data, count it, and alert if the count is less than whatever.
index=whatever sourcetype=yoursourcetype |stats count(_raw) AS COUNT
Or, if you have a field, count that.
index=whatever sourcetype=yoursourcetype |stats count(FOO) AS COUNT
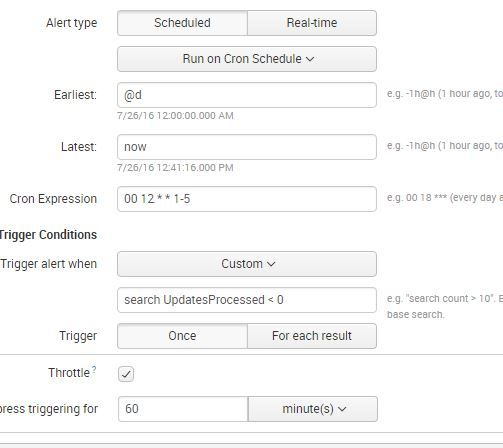
Then in the trigger condition of the alert if number of events is less than some number.. it will alert.
This is just an example of one I use when an update process that runs daily does not run.
- Mark as New
- Bookmark Message
- Subscribe to Message
- Mute Message
- Subscribe to RSS Feed
- Permalink
- Report Inappropriate Content
Hey @skoelpin,
Setting up an alert will help if it's only one forwarder/host/sourcetype you have complains with. It will get cumbersome if you have 1000s of machines doing the same randomly(Especially when you do not know which one might skip/break).
- Use this query to monitor the forwarder status that are reporting to your instance
- Run for hosts that are deviated or look suspicious
- Have that data written to an event
Build Alerts on those events. It is not going to be easy 🙂 I have done something similar. Atleast i now know that the triggered alerts are denoting a data forwarding issue.
index=_internal source=*metrics.log group=tcpin_connections
| eval sourceHost=if(isnull(hostname), sourceHost,hostname)
| rename connectionType as connectType
| eval connectType=case(fwdType=="uf","univ fwder", fwdType=="lwf", "lightwt fwder",fwdType=="full", "heavy fwder", connectType=="cooked" or connectType=="cookedSSL","Splunk fwder", connectType=="raw" or connectType=="rawSSL","legacy fwder")
| eval version=if(isnull(version),"pre 4.2",version)
| rename version as Ver
| fields connectType sourceIp sourceHost destPort kb tcp_eps tcp_Kprocessed tcp_KBps splunk_server Ver
| eval Indexer= splunk_server
| eval Hour=relative_time(_time,"@h")
| stats avg(tcp_KBps) sum(tcp_eps) sum(tcp_Kprocessed) sum(kb) by Hour connectType sourceIp sourceHost destPort Indexer Ver
| fieldformat Hour=strftime(Hour,"%x %H")
Hope this helps and please do not forget to post if you find a better solution.
Thanks,
Raghav
- Mark as New
- Bookmark Message
- Subscribe to Message
- Mute Message
- Subscribe to RSS Feed
- Permalink
- Report Inappropriate Content
I don't know if its the best way to do it, but I run a simple search against the data, count it, and alert if the count is less than whatever.
index=whatever sourcetype=yoursourcetype |stats count(_raw) AS COUNT
Or, if you have a field, count that.
index=whatever sourcetype=yoursourcetype |stats count(FOO) AS COUNT
Then in the trigger condition of the alert if number of events is less than some number.. it will alert.
This is just an example of one I use when an update process that runs daily does not run.

