- Splunk Answers
- :
- Using Splunk
- :
- Reporting
- :
- How to interpret DMC iostats reports
- Subscribe to RSS Feed
- Mark Topic as New
- Mark Topic as Read
- Float this Topic for Current User
- Bookmark Topic
- Subscribe to Topic
- Mute Topic
- Printer Friendly Page
- Mark as New
- Bookmark Message
- Subscribe to Message
- Mute Message
- Subscribe to RSS Feed
- Permalink
- Report Inappropriate Content
How to interpret DMC iostats reports
Hi,
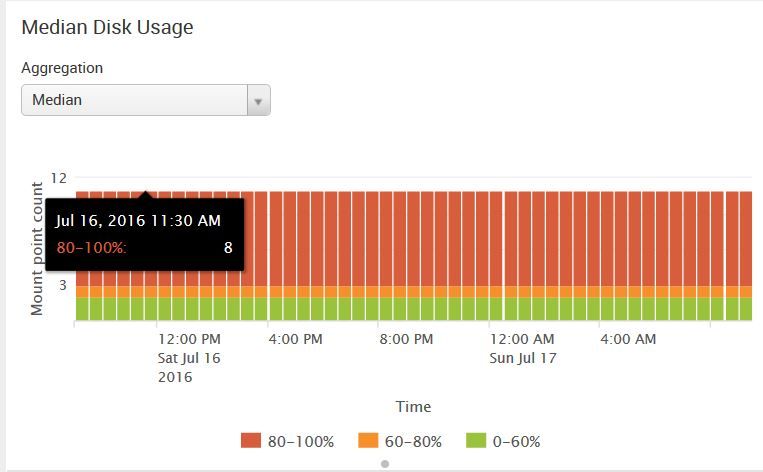
We just upgraded to Splunk 6.4.1 this weekend (yay team!). I'm looking into the awesomeness of the DMC, and two reports have me perplexed - the "Maximum IO Bandwidth" and the "Median Disk Usage". I have a fair amount of "red" in those reports. I clicked on the "learn more" link, but all it does it take me to the main Splunk doc page. Can someone explain these reports? I've attached an example.
- Mark as New
- Bookmark Message
- Subscribe to Message
- Mute Message
- Subscribe to RSS Feed
- Permalink
- Report Inappropriate Content
Quick lazy thought: did you post this question (or a link to this answers post) on the corresponding dashboard's doc page? At the bottom (footer) of the docs page should be a place to ask this to get them to clarify in the docs the answer to your question.
- Mark as New
- Bookmark Message
- Subscribe to Message
- Mute Message
- Subscribe to RSS Feed
- Permalink
- Report Inappropriate Content
I'm looking at our own 6.4.1 DMC.
I see the following when we look at Resource Usage: Instance
We see two mount points while in your case we don't see them and simply the disk usage against these file systems.
Looking under Resource Usage: Deployment at the Median Disk Usage and we see the graph you posted. One way is to look at the search it generates -
`dmc_set_index_introspection` search_group=* search_group=* sourcetype=splunk_disk_objects component=Partitions
| eval mount_point = 'data.mount_point'
| eval free = if(isnotnull('data.available'), 'data.available', 'data.free')
| eval pct_disk_usage = 1 - free / 'data.capacity'
| `dmc_set_bin_for_timechart_for_disk_usage`
| eval server_mount_point = host.":".mount_point
| stats Median(pct_disk_usage) as pct_disk_usage by server_mount_point _time
| `dmc_disk_usage_rangemap_and_timechart`


