- Splunk Answers
- :
- Using Splunk
- :
- Dashboards & Visualizations
- :
- How to create the incident dashboard in splunk lig...
- Subscribe to RSS Feed
- Mark Topic as New
- Mark Topic as Read
- Float this Topic for Current User
- Bookmark Topic
- Subscribe to Topic
- Mute Topic
- Printer Friendly Page
- Mark as New
- Bookmark Message
- Subscribe to Message
- Mute Message
- Subscribe to RSS Feed
- Permalink
- Report Inappropriate Content
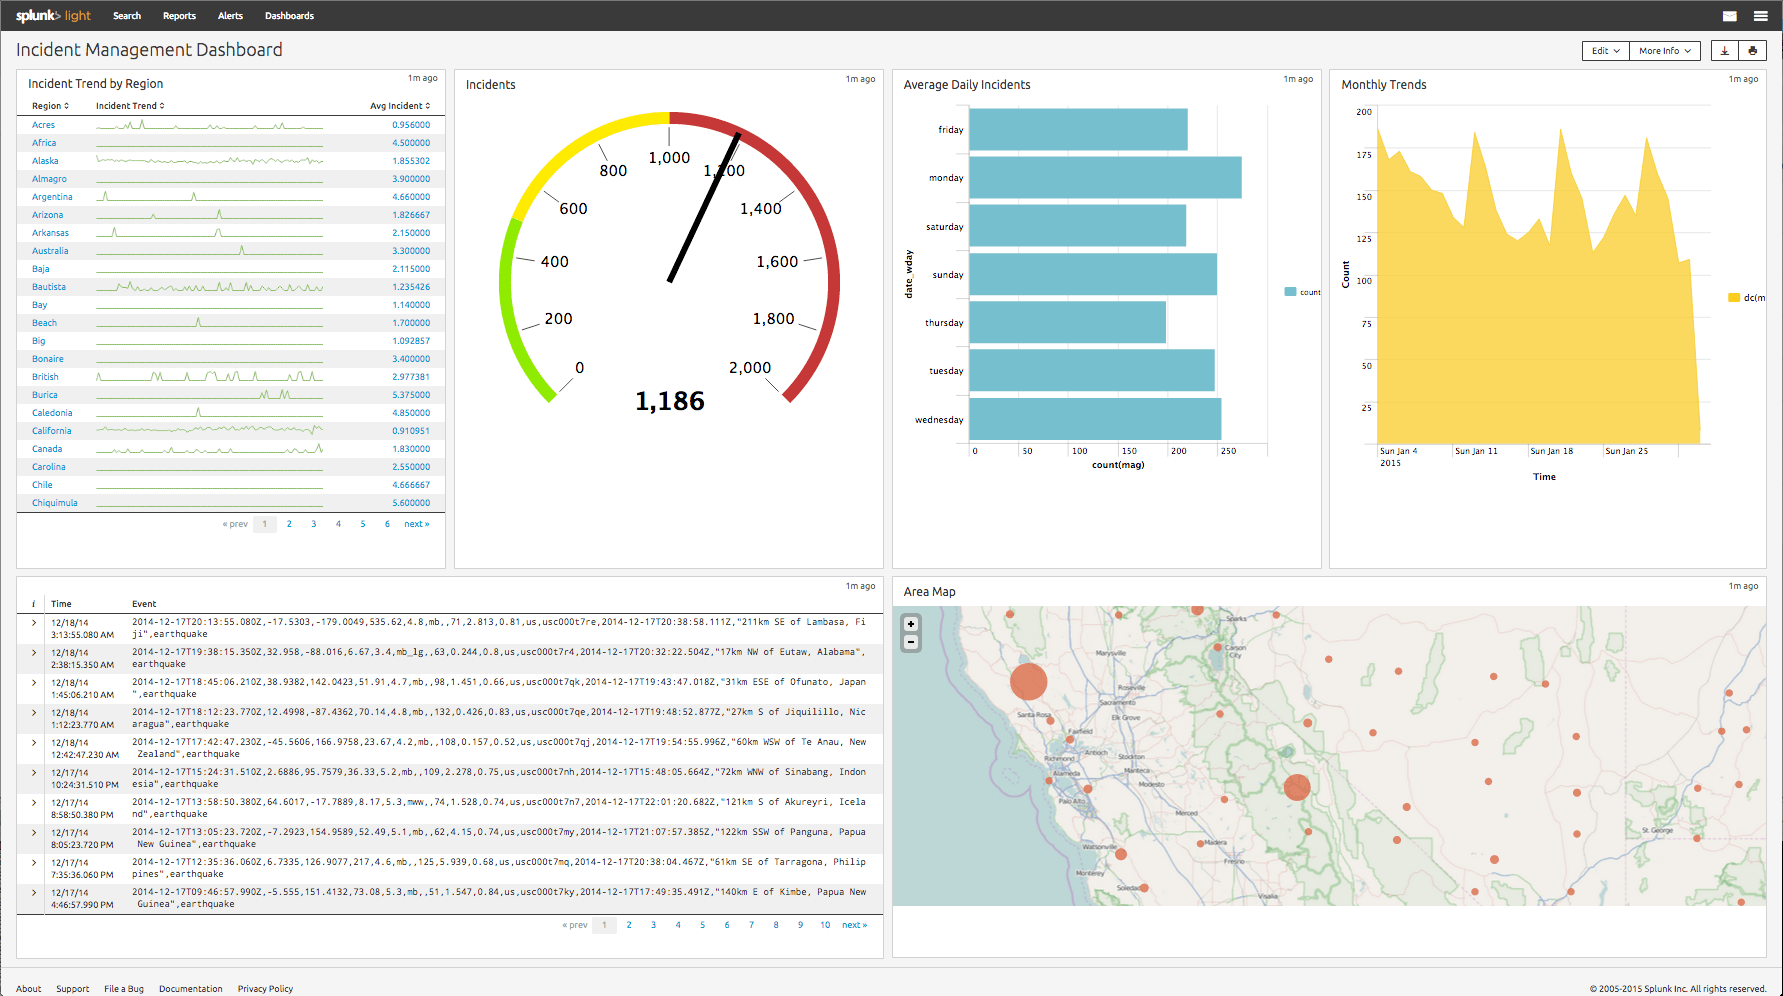
How to create the incident dashboard in splunk light?
In splunk light i need a dashboard to display all the server charts in single page
- Mark as New
- Bookmark Message
- Subscribe to Message
- Mute Message
- Subscribe to RSS Feed
- Permalink
- Report Inappropriate Content
The screenshot which you have can be achieved by creating individual multiple panels. In your case 6 individual splunk searches (saved as panels) combined to create this beautiful dashboard.
This tutorial will guide you on creating dashboards
http://www.splunk.com/view/SP-CAAANZH
http://www.splunk.com/view/SP-CAAAGXD
This one also
http://www.learnsplunk.com/dashboards-in-splunk.html
Moreover, I suggest Enterprise version if your planning for production environment or realtime dashboards.
- Mark as New
- Bookmark Message
- Subscribe to Message
- Mute Message
- Subscribe to RSS Feed
- Permalink
- Report Inappropriate Content
Your screen shot shows a dashboard like the one you describe. So it seems as if you already have it? Or are you trying to recreate this yourself? Or is your question about how to create a multi-panel dashboard in general? For information about adding panels to dashboards, see Add panels to dashboards in the Dashboards and Visualizations manual for Splunk Enterprise.
ICYMI - Check out the latest releases of Splunk Edge Processor
Introducing the 2024 SplunkTrust!
Introducing the 2024 Splunk MVPs!
