- Splunk Answers
- :
- Using Splunk
- :
- Splunk Search
- :
- Receive cooked data to index securitylogs
- Subscribe to RSS Feed
- Mark Topic as New
- Mark Topic as Read
- Float this Topic for Current User
- Bookmark Topic
- Subscribe to Topic
- Mute Topic
- Printer Friendly Page
- Mark as New
- Bookmark Message
- Subscribe to Message
- Mute Message
- Subscribe to RSS Feed
- Permalink
- Report Inappropriate Content
We have some Appliances (Open System Webproxy), they can send Splunk cooked data into Splunk.
I want to receive the data to a restricted index (securitylogs).
In a first try I configured the listening port in the Webui, Setting -> Forwarding and receiving -> Configure receiving -> added Port 3514
This was working but it was using the main index. So I've reconfigured it in the app "config_all_indexers":
inputs.conf
[splunktcp://3514]
disabled = 0
index = securitylogs
Then I used the "| delete" function to remove the data from the main index.
Now I dont get any data from the appliances anymore and I've no idea why..
Maybe someone can give me a hint whats the problem of my config?
- Mark as New
- Bookmark Message
- Subscribe to Message
- Mute Message
- Subscribe to RSS Feed
- Permalink
- Report Inappropriate Content
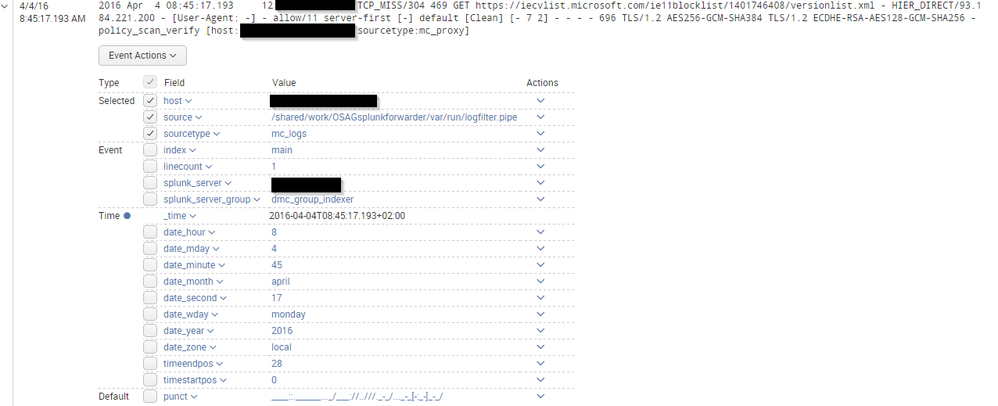
Thank you for the tips.
I've changed nothing but now I'm receiving events.
Unfortunately they go to the main index..
How can I change that?
- Mark as New
- Bookmark Message
- Subscribe to Message
- Mute Message
- Subscribe to RSS Feed
- Permalink
- Report Inappropriate Content
- Mark as New
- Bookmark Message
- Subscribe to Message
- Mute Message
- Subscribe to RSS Feed
- Permalink
- Report Inappropriate Content
I've found another article that states "The "splunktcp" input is not a data input, but instead an input to listen to Splunk Forwarders."
So I've configured it with props.conf and transforms.conf:
props.conf
[mc_logs]
TRANSFORMS-index=sendtomyindex
transforms.conf
[sendtomyindex]
SOURCE_KEY=_MetaData:Index
DEST_KEY=_MetaData:Index
REGEX=(.*)
FORMAT=securitylogs
Now the data goes to the index "securitylogs".
- Mark as New
- Bookmark Message
- Subscribe to Message
- Mute Message
- Subscribe to RSS Feed
- Permalink
- Report Inappropriate Content
It sounds like you have it configured properly. I'd take the following steps to troubleshoot what might be going on:
- Run tcpdump on the indexer where you have that input & index configured, do you see traffic making its way to that indexer?
- Run netstat -an | grep 3514 on the indexer to ensure the port is open & listening
- Examine the securitylogs index to ensure it's growing
- Run index=* source="tcp:3514" to see if it's going to a different index (you may want to run it on the search heads & the indexers)
- Run index=_internal and search for anything relating to the cooked logs or a host configured to send logs to your indexers
- Mark as New
- Bookmark Message
- Subscribe to Message
- Mute Message
- Subscribe to RSS Feed
- Permalink
- Report Inappropriate Content
Did you configure the securitylogs index in indexes.conf on all of your indexers (and then restart them)?
- Mark as New
- Bookmark Message
- Subscribe to Message
- Mute Message
- Subscribe to RSS Feed
- Permalink
- Report Inappropriate Content
It is configured in the app config_all_indexers which is deployed to all indexers.
I've restarted splunkd on all indexers.

