- Splunk Answers
- :
- Using Splunk
- :
- Dashboards & Visualizations
- :
- Passing tokens from single value
- Subscribe to RSS Feed
- Mark Topic as New
- Mark Topic as Read
- Float this Topic for Current User
- Bookmark Topic
- Subscribe to Topic
- Mute Topic
- Printer Friendly Page
- Mark as New
- Bookmark Message
- Subscribe to Message
- Mute Message
- Subscribe to RSS Feed
- Permalink
- Report Inappropriate Content
Passing tokens from single value
I have a fixed view that shows the number of devices in a given state for a 24hour window:
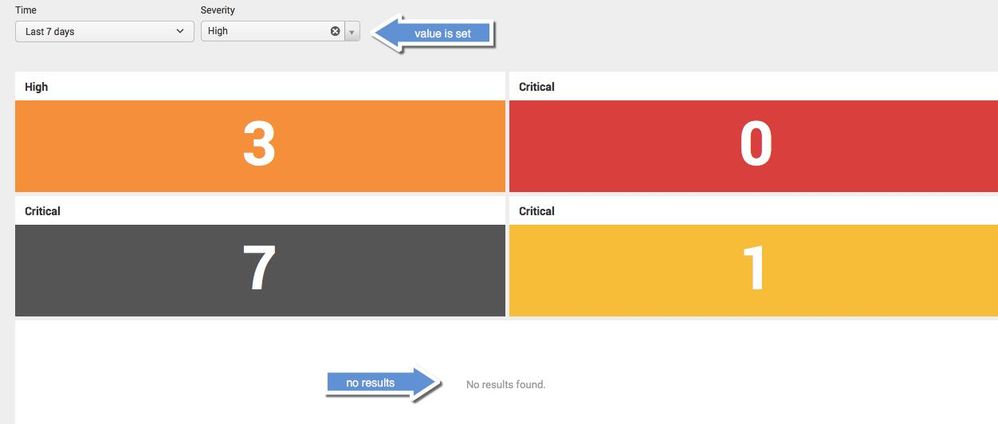
I would like to be able to drill into one of these and jump to another view/dashboard that shows more of the details around the values. The challenge I am running in to is that I am passing a token 'hostseverity' and the dashboard seems to accept the token, but it does not return anything in the results pane:
Now if I go in and change the severity manually, the results will populate as expected. The code I am using for the single value is:
    <option name="drilldown">all</option>
    <drilldown>
      <link>hosts?form.hostseverity=High</link>
    </drilldown>
- Mark as New
- Bookmark Message
- Subscribe to Message
- Mute Message
- Subscribe to RSS Feed
- Permalink
- Report Inappropriate Content
ryandg, in gathering the information for you request, I identified the source of my issue.
The code for the input that was on the 'hosts' page was teh following:
    <input type="dropdown" token="hostseverity" searchWhenChanged="true">
      <label>Severity</label>
      <choice value="threat>0 AND certainty>0">All</choice>
      <choice value="threat>=50 certainty>=50">Critical</choice>
      <choice value="threat>=50 certainty<=50">High</choice>
      <choice value="threat<=50 certainty>=50">Medium</choice>
      <choice value="threat>0 AND threat<50 certainty>0 AND certainty<50">Low</choice>
      <initialValue>threat>0 AND certainty>0</initialValue>
    </input>
In the drilldown, I actually provided the named and not the value. So by changing
hosts?form.hostseverity=High
to:
hosts?form.hostseverity=threat%3E%3D50%20certainty%3C%3D50
I solved my problem.
Thanks for your help.
- Mark as New
- Bookmark Message
- Subscribe to Message
- Mute Message
- Subscribe to RSS Feed
- Permalink
- Report Inappropriate Content
Can you include the code when you are trying to pass the token as well as the settings for the host severity input?


