- Splunk Answers
- :
- Using Splunk
- :
- Splunk Search
- :
- How to count the number of opened and closed incid...
- Subscribe to RSS Feed
- Mark Topic as New
- Mark Topic as Read
- Float this Topic for Current User
- Bookmark Topic
- Subscribe to Topic
- Mute Topic
- Printer Friendly Page
- Mark as New
- Bookmark Message
- Subscribe to Message
- Mute Message
- Subscribe to RSS Feed
- Permalink
- Report Inappropriate Content
Hi,
I've searched throughout Answers for some time now and didn't find any, unfortunately.
Got in my Splunk environment an event per Incident, which contain both the dates at which it was opened, and the date at which it was closed.
It pretty much looks like this:
_time,number,priority,opened_at,closed_at
2016-03-02 09:16:04,1,High,2016-03-02 09:16:04,2016-03-02 10:33:09
2016-03-02 09:25:42,2,Medium,2016-03-02 09:25:42,
2016-03-02 09:28:24,3,High,2016-03-02 09:28:24,2016-03-02 09:39:02
2016-03-02 09:28:25,4,High,2016-03-02 09:28:25,2016-03-02 09:40:33
2016-03-02 10:48:33,5,Critical,2016-03-02 10:48:33,
2016-03-02 10:55:11,6,Low,2016-03-02 10:55:11,
2016-03-02 12:34:07,7,Medium,2016-03-02 12:34:07,2016-03-02 17:46:21
2016-03-02 15:29:03,8,Medium,2016-03-02 15:29:03,2016-03-03 00:55:39
Note that some events don't have a set closed_at date, as they haven't been closed yet, and also please note that the _time is set at the same time as opened_at.
My goal is to calculate the number of opened incidents and closed ones through time (without pulling out the events twice with a subsearch where I would set the _time to closed_at), pretty much like this:
https://sourceforge.net/blog/communityhub/uploads/2011/11/screen-shot-2011-11-22-at-23723-pm-600x349....
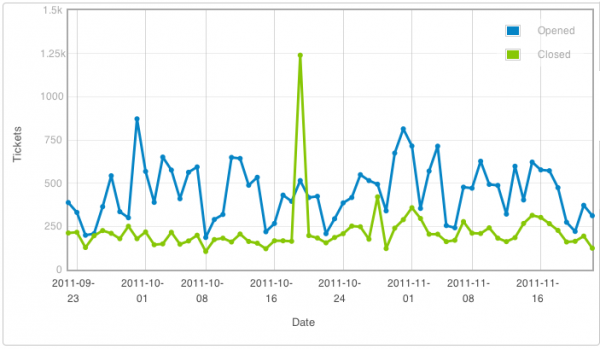
I've tried several things, but with no luck.
So, here's the beginning of my request where I transform the dates fields as epoch time fields:
search
| eval opened_at=strptime(opened_at, "%Y-%m-%d %H:%M:%S")
| eval closed_at=strptime(closed_at, "%Y-%m-%d %H:%M:%S")
Any help would be greatly appreciated.
Thank you,
Romain
- Mark as New
- Bookmark Message
- Subscribe to Message
- Mute Message
- Subscribe to RSS Feed
- Permalink
- Report Inappropriate Content
just thinking out loud here...so you want to have a count of opened/closed events over time, right? Here's one thought...not sure if it hits the mark.
To display open/closed on a timechart, then I don't think those dates can live in one event. Because the timechart will only use one field as _time.
So maybe start by creating new multi-value field called say eventTime that is a combination of open/close time. Maybe like
... | eval eventTime = split(opened_at."|".closed_at,"|")
Now use mvexpand to create a separate event for each of those fields
... | mvexpand eventTime
So now you should have two events for every one you had before (except maybe those that are still open). And now you can decide what type of event it is
... | eval status = if(eventTime=opened_at,"Opened","Closed")
Then set _time to that eventTime and timechart it
... | _time = eventTime | timechart count by status
- Mark as New
- Bookmark Message
- Subscribe to Message
- Mute Message
- Subscribe to RSS Feed
- Permalink
- Report Inappropriate Content
your_base_search| eval status=if(isnotnull(closed_at),"yes","no")| bucket span=1d _time|stats count(eval(status="yes")) as "number of opened incidents" count(eval(status="no")) as "number of closed incidents" by _time
- Mark as New
- Bookmark Message
- Subscribe to Message
- Mute Message
- Subscribe to RSS Feed
- Permalink
- Report Inappropriate Content
Thank you for your help, but I don't think this would work as you're not really taking into a the closed_at time; an incident can be opened on a day but closed a month later.
- Mark as New
- Bookmark Message
- Subscribe to Message
- Mute Message
- Subscribe to RSS Feed
- Permalink
- Report Inappropriate Content
for month, you take ...| bucket span=1months _time|...
- Mark as New
- Bookmark Message
- Subscribe to Message
- Mute Message
- Subscribe to RSS Feed
- Permalink
- Report Inappropriate Content
just thinking out loud here...so you want to have a count of opened/closed events over time, right? Here's one thought...not sure if it hits the mark.
To display open/closed on a timechart, then I don't think those dates can live in one event. Because the timechart will only use one field as _time.
So maybe start by creating new multi-value field called say eventTime that is a combination of open/close time. Maybe like
... | eval eventTime = split(opened_at."|".closed_at,"|")
Now use mvexpand to create a separate event for each of those fields
... | mvexpand eventTime
So now you should have two events for every one you had before (except maybe those that are still open). And now you can decide what type of event it is
... | eval status = if(eventTime=opened_at,"Opened","Closed")
Then set _time to that eventTime and timechart it
... | _time = eventTime | timechart count by status
- Mark as New
- Bookmark Message
- Subscribe to Message
- Mute Message
- Subscribe to RSS Feed
- Permalink
- Report Inappropriate Content
Maciep,
Thank you for your answer and help here.
I've been able to solve my problem pretty much your way:
search
| eval opened_at=strptime(opened_at, "%Y-%m-%d %H:%M:%S")
| eval closed_at=strptime(closed_at, "%Y-%m-%d %H:%M:%S")
| eval status=mvappend("opened","closed")
| mvexpand status
| eval _time=case(status="opened", opened_at, status="closed", closed_at)
| timechart span=1mon count by status
What do you think?
- Mark as New
- Bookmark Message
- Subscribe to Message
- Mute Message
- Subscribe to RSS Feed
- Permalink
- Report Inappropriate Content
I like that approach, seems a simpler than what I had and still gets the job done.
Introducing the 2024 SplunkTrust!
Introducing the 2024 Splunk MVPs!
Splunk Custom Visualizations App End of Life
