- Splunk Answers
- :
- Using Splunk
- :
- Splunk Search
- :
- Why is the count of indexed events shown under “Wh...
- Subscribe to RSS Feed
- Mark Topic as New
- Mark Topic as Read
- Float this Topic for Current User
- Bookmark Topic
- Subscribe to Topic
- Mute Topic
- Printer Friendly Page
- Mark as New
- Bookmark Message
- Subscribe to Message
- Mute Message
- Subscribe to RSS Feed
- Permalink
- Report Inappropriate Content
- Mark as New
- Bookmark Message
- Subscribe to Message
- Mute Message
- Subscribe to RSS Feed
- Permalink
- Report Inappropriate Content
1)First thing to eliminate will be that caused by the fact that "| metadata" (and therefore, that UI Panel) is scoped by default to the default set of indexes that the user in question is set to search - as per http://docs.splunk.com/Documentation/Splunk/6.3.0/SearchReference/Metadata :
As mentioned by the following section in above link
Optional arguments[edit]
index-specifier
Syntax: index=
Description: Specify the index from which to return results. Wildcards () can be used. index= matches non-internal indexes. index=_* matches internal indexes.
Default: The default index, which is usually main
So I'm pretty sure that this is governed by the following role-specific setting in authorize.conf:
srchIndexesDefault =
* Semicolon delimited list of indexes to search when no index is specified
* These indexes can be wildcarded, with the exception that '' does not
match internal indexes
* To match internal indexes, start with ''. All internal indexes are
represented by ''
* Defaults to none, but the UI will automatically populate this with 'main'
in manager
2)One very simple way to check this is to check what kind of event count you get with:
| metadata type=sourcetypes | stats sum(totalCount) AS total_event_count_of_indexes_searched_by_default
and
| metadata type=sourcetypes index=* | stats sum(totalCount) AS total_event_count_of_all_searchable_indexes
3) In case the search in (2) both return incorrect count, next you can try and rebuild metadata - using the following command
splunk cmd splunkd recover-metadata /localhome/igor/local/core/var/lib/splunk/defaultdb/db/db_1442694953_1442694953_0
This command is referred at link --http://docs.splunk.com/Documentation/Splunk/6.3.0/Troubleshooting/Buckets
- Mark as New
- Bookmark Message
- Subscribe to Message
- Mute Message
- Subscribe to RSS Feed
- Permalink
- Report Inappropriate Content
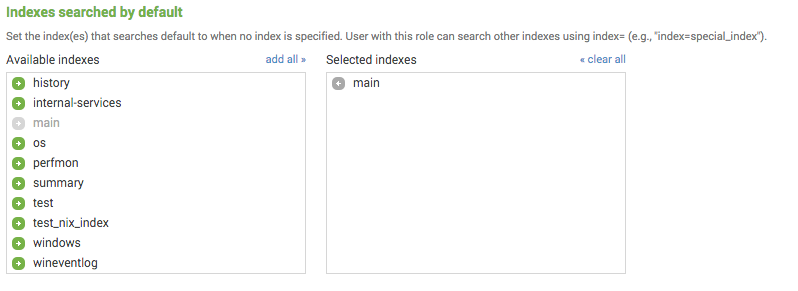
Those are just the indexes that are searched by default.
If you go to:
- Settings > User Access > Roles
- chose a specific role
- Scroll to the bottom
You will see:
The counts you're talking about in the data summary are only reflective of the indexes that are searched by default.
Here are a few other ways to get an event count:
| eventcount index=*
Or internal indexes:
| eventcount index=_*
Or try using the metadata command:
| metadata type=sourcetypes index=*
There are many other ways of course.


