- Splunk Answers
- :
- Using Splunk
- :
- Splunk Search
- :
- How to create a timechart with overlay lines for M...
- Subscribe to RSS Feed
- Mark Topic as New
- Mark Topic as Read
- Float this Topic for Current User
- Bookmark Topic
- Subscribe to Topic
- Mute Topic
- Printer Friendly Page
- Mark as New
- Bookmark Message
- Subscribe to Message
- Mute Message
- Subscribe to RSS Feed
- Permalink
- Report Inappropriate Content
Hi,
I have a number of timecharts displaying KPIs over the last 30 days.
What would be the most efficient way to add in overlay lines with the Mean, Upper Control Limit, Lower Control Limit, and Targets?
The end result would be much like the below.
http://www.kaushik.net/avinash/excellent-analytics-tip-9-leverage-statistical-control-limits/
Does anyone have any examples?
Thanks,
Dan
- Mark as New
- Bookmark Message
- Subscribe to Message
- Mute Message
- Subscribe to RSS Feed
- Permalink
- Report Inappropriate Content
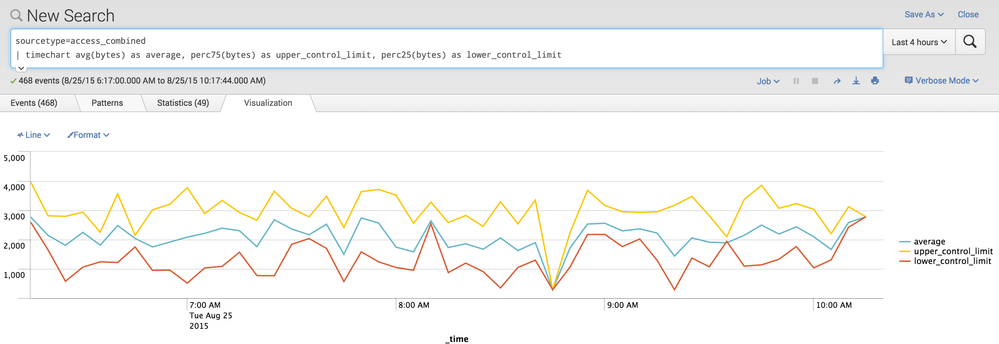
I think the simplest upper control / lower control limits are probably accomplished by using the perc##() percentile function of the timechart command.
sourcetype=access_combined
| timechart avg(bytes) as average, perc75(bytes) as upper_control_limit, perc25(bytes) as lower_control_limit
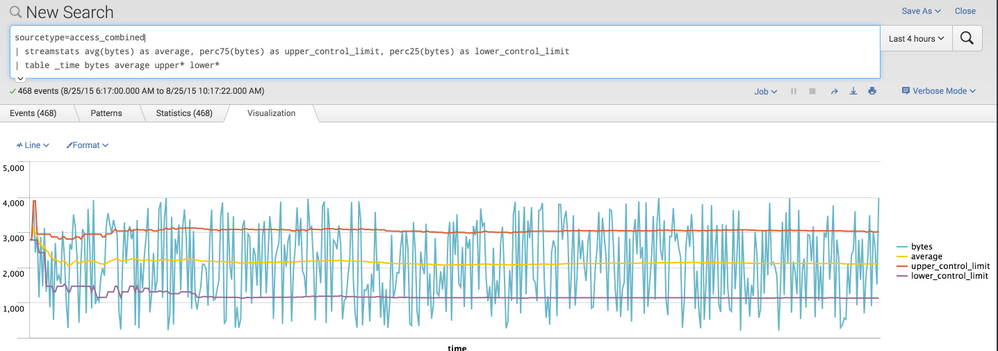
However, that is not really what you asked for. What you asked for more directly might look like this:
sourcetype=access_combined
| streamstats avg(bytes) as average, perc75(bytes) as upper_control_limit, perc25(bytes) as lower_control_limit
| table _time bytes average upper* lower*
Of course, you use use eval to set static thresholds as well.
sourcetype=access_combined
| eval upper = 3000
| eval lower = 1000
| streamstats avg(bytes) as average
| table _time bytes average upper lower

To go even further, directly as that article suggests - though note it isn't necessarily the only way to do this, would be something like this...
sourcetype=access_combined
| eventstats avg(bytes) as average, stdev(bytes) as stdev
| eval upper = average+(stdev*3)
| eval lower = average-(stdev*3)
| table _time bytes upper lower
- Mark as New
- Bookmark Message
- Subscribe to Message
- Mute Message
- Subscribe to RSS Feed
- Permalink
- Report Inappropriate Content
I think the simplest upper control / lower control limits are probably accomplished by using the perc##() percentile function of the timechart command.
sourcetype=access_combined
| timechart avg(bytes) as average, perc75(bytes) as upper_control_limit, perc25(bytes) as lower_control_limit
However, that is not really what you asked for. What you asked for more directly might look like this:
sourcetype=access_combined
| streamstats avg(bytes) as average, perc75(bytes) as upper_control_limit, perc25(bytes) as lower_control_limit
| table _time bytes average upper* lower*
Of course, you use use eval to set static thresholds as well.
sourcetype=access_combined
| eval upper = 3000
| eval lower = 1000
| streamstats avg(bytes) as average
| table _time bytes average upper lower

To go even further, directly as that article suggests - though note it isn't necessarily the only way to do this, would be something like this...
sourcetype=access_combined
| eventstats avg(bytes) as average, stdev(bytes) as stdev
| eval upper = average+(stdev*3)
| eval lower = average-(stdev*3)
| table _time bytes upper lower


