Turn on suggestions
Auto-suggest helps you quickly narrow down your search results by suggesting possible matches as you type.
Showing results for
Dashboards & Visualizations
Turn on suggestions
Auto-suggest helps you quickly narrow down your search results by suggesting possible matches as you type.
Showing results for
- Splunk Answers
- :
- Using Splunk
- :
- Dashboards & Visualizations
- :
- Has anyone created Isopleth or Contour Graphs in S...
Options
- Subscribe to RSS Feed
- Mark Topic as New
- Mark Topic as Read
- Float this Topic for Current User
- Bookmark Topic
- Subscribe to Topic
- Mute Topic
- Printer Friendly Page
- Mark as New
- Bookmark Message
- Subscribe to Message
- Mute Message
- Subscribe to RSS Feed
- Permalink
- Report Inappropriate Content
Has anyone created Isopleth or Contour Graphs in Splunk? Is it possible?
hvandenb
Path Finder
09-19-2014
11:38 AM
We have a need to create these type of graphs similar to the image listed below. There seems to be some D3 contour plugin that could help. So my question is has anyone created these type of graphs in Splunk before?!
Here is my desired result Water Temp
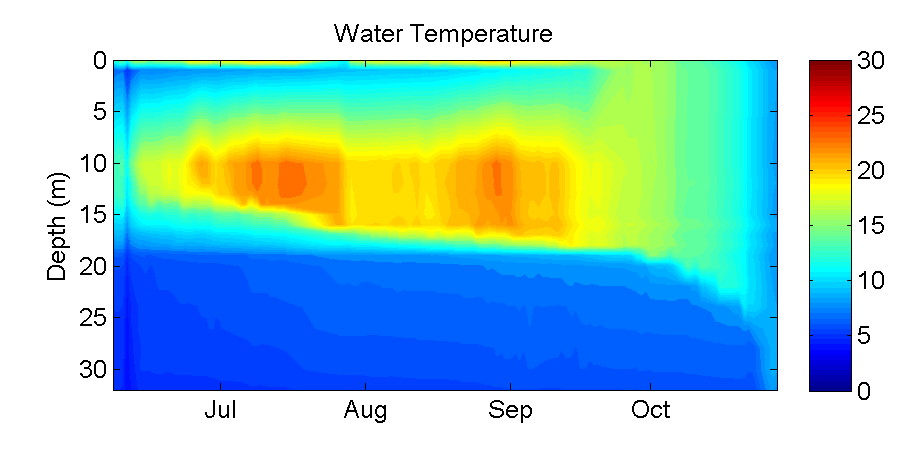
- Mark as New
- Bookmark Message
- Subscribe to Message
- Mute Message
- Subscribe to RSS Feed
- Permalink
- Report Inappropriate Content
ChrisG

Splunk Employee
09-19-2014
03:18 PM
I have not done it, but I know you can use the web framework to add a D3 visualization, have you investigated that? http://dev.splunk.com/view/webframework-splunkjsstack/SP-CAAAEN6.
- Mark as New
- Bookmark Message
- Subscribe to Message
- Mute Message
- Subscribe to RSS Feed
- Permalink
- Report Inappropriate Content
hvandenb
Path Finder
09-19-2014
03:59 PM
Chris -
I have looked at the framework and integrating D3, however, I was hoping someone has an example using this specific type of graph.
Get Updates on the Splunk Community!
Announcing Scheduled Export GA for Dashboard Studio
We're excited to announce the general availability of Scheduled Export for Dashboard Studio. Starting in ...
Extending Observability Content to Splunk Cloud
Watch Now!
In this Extending Observability Content to Splunk Cloud Tech Talk, you'll see how to leverage ...
More Control Over Your Monitoring Costs with Archived Metrics GA in US-AWS!
What if there was a way you could keep all the metrics data you need while saving on storage costs?This is now ...
