- Splunk Answers
- :
- Using Splunk
- :
- Dashboards & Visualizations
- :
- Change color of column in chart using 2 fields
- Subscribe to RSS Feed
- Mark Topic as New
- Mark Topic as Read
- Float this Topic for Current User
- Bookmark Topic
- Subscribe to Topic
- Mute Topic
- Printer Friendly Page
- Mark as New
- Bookmark Message
- Subscribe to Message
- Mute Message
- Subscribe to RSS Feed
- Permalink
- Report Inappropriate Content
Change color of column in chart using 2 fields
I have a search query that gives me a count of vulnerabilities broken down by age (in days). I want to be able to have a different color for each column. The columns are, in days, 0-30 (light green), 31-60 (orange), 61-90 (light blue), 91-180 (yellow), and Older than 180 (red). When I use 'charting.seriesColors', all of the columns turn light green.
Search query:
index=qualys_host_detection TYPE=CONFIRMED ("severity=3" OR "severity=4" OR "severity=5") OS="Windows Server*" OR "Microsoft Windows Server" OR "VMWare" STATUS!=FIXED | dedup QID, HOST_ID | eval firstseen=strptime(FIRST_FOUND_DATETIME, "%Y-%m-%dT%H:%M:%S"), epochnow=now(), duration=round((epochnow-firstseen)/86400,0), days=case(duration<=30, "0-30", duration>30 AND duration<=60, "31-60", duration>60 AND duration<=90, "61-90", duration>90 AND duration<=180, "91-180", duration>180, "Older than 180") | stats count by days
- Mark as New
- Bookmark Message
- Subscribe to Message
- Mute Message
- Subscribe to RSS Feed
- Permalink
- Report Inappropriate Content
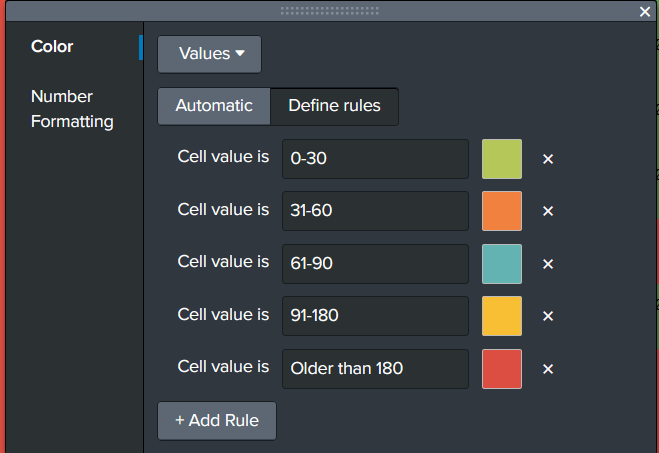
I can get the colors to change when using the paint brush, but I am still having an issue when it comes to the column chart. All of the columns change to the first color listed. The above code for the color pallete did not change anything.
- Mark as New
- Bookmark Message
- Subscribe to Message
- Mute Message
- Subscribe to RSS Feed
- Permalink
- Report Inappropriate Content
Ok, columns (Table) I was thinking Chart. was late last night
You want to use the paint brush on the Column -> Color -> Values -> Defined Values

<format type="color" field="days">
<colorPalette type="map">{"0-30":#B6C75A,"31-60":#F1813F,"61-90":#62B3B2,"91-180":#F8BE34,"Older than 180":#DC4E41}</colorPalette>
</format>
- Mark as New
- Bookmark Message
- Subscribe to Message
- Mute Message
- Subscribe to RSS Feed
- Permalink
- Report Inappropriate Content
Thanks, kennetkline. I have tried what you have suggested, but it changes all of the columns to the color listed first. I need to figure out how to change all of the columns to their respective colors.
- Mark as New
- Bookmark Message
- Subscribe to Message
- Mute Message
- Subscribe to RSS Feed
- Permalink
- Report Inappropriate Content
You can setup your chart item and edit and switch to sources:
You would then put something in like such:
<option name="charting.fieldColors">{"0-30": 0x009900, "31-60": 0xFF6600, "61-90": 0x66CCFF, "91-180": 0xFFFF00, "Older than 180": 0xFF0000}</option>
if you just use an array: (not perferred):
This one is not good (if there are not any matches for certain states of days; you risk colors to be matched to the first entry in the array. not the color you desire; unless you do some make results stuff to for each state in your output of your search to ensure all states show up 0-30,31-60,61-90,91-180, older than 180.
<option name="charting.seriesColors">[0x009900, 0xFF6600, 0x66CCFF, 0xFFFF00,0xFF000]</option>
to sample below; you can use HEX Color editor to pick your preferred Shades of Colors.
<panel>
<title>CRITICAL</title>
<chart>
<search>
<query>
index=qualys_host_detection TYPE=CONFIRMED ("severity=3" OR "severity=4" OR "severity=5") OS="Windows Server*" OR "Microsoft Windows Server" OR "VMWare" STATUS!=FIXED | dedup QID, HOST_ID | eval firstseen=strptime(FIRST_FOUND_DATETIME, "%Y-%m-%dT%H:%M:%S"), epochnow=now(), duration=round((epochnow-firstseen)/86400,0), days=case(duration<=30, "0-30", duration>30 AND duration<=60, "31-60", duration>60 AND duration<=90, "61-90", duration>90 AND duration<=180, "91-180", duration>180, "Older than 180") | stats count by days
</query>
</search>
<option name="charting.axisTitleX.visibility">visible</option>
<option name="charting.axisTitleY.visibility">visible</option>
<option name="charting.axisTitleY2.visibility">visible</option>
<option name="charting.chart">pie</option>
<option name="charting.drilldown">none</option>
<option name="charting.legend.placement">right</option>
<option name="charting.fieldColors">{"0-30": 0x009900, "31-60": 0xFF6600, "61-90": 0x66CCFF, "91-180": 0xFFFF00, "Older than 180": 0xFF0000}</option>
</chart>
</panel>
