- Splunk Answers
- :
- Using Splunk
- :
- Dashboards & Visualizations
- :
- How to keep consistent pie chart colors that are a...
- Subscribe to RSS Feed
- Mark Topic as New
- Mark Topic as Read
- Float this Topic for Current User
- Bookmark Topic
- Subscribe to Topic
- Mute Topic
- Printer Friendly Page
- Mark as New
- Bookmark Message
- Subscribe to Message
- Mute Message
- Subscribe to RSS Feed
- Permalink
- Report Inappropriate Content
Hi,
in simple XML I've got a search:
* "OK" OR "WARNING" OR "DOWN" OR "UNKNOWN" OR "TESTING" | rex "(?(DOWN|OK|WARNING|UNKNOWN|TESTING))" | chart count by printer_status
and assigned pie colours like:
{DOWN:0xff5050,OK:0x5cad5c,WARNING:0xffcc33,UNKNOWN:0x909090,TESTING:0x909090}
which is great.
Then I added values at the end of the labels (valid solution found on forums) by amending to:
* "OK" OR "WARNING" OR "DOWN" OR "UNKNOWN" OR "TESTING" | rex "(?(DOWN|OK|WARNING|UNKNOWN|TESTING))" | chart count by printer_status | eval foobar_slice = printer_status + " (" + count + ")" | fields foobar_slice, count
which is brilliant but it brings pie colours to defaults as the label is no longer "OK" but for example "OK (5)"
How can I keep consistent colours for labels that vary?
seriesColors property is out of the question because not always all printer_status is present.
I assume this can be achieved similar to when enabling showPercent to true which shows nicely precentage at the end of the label. But in my case I wanted to show count of the printer_status and not the precentage.
- Mark as New
- Bookmark Message
- Subscribe to Message
- Mute Message
- Subscribe to RSS Feed
- Permalink
- Report Inappropriate Content
I think the easiest way to achieve this is to use seriesColors and to make all the status appear all the time, even with a count of zero.
... | chart count by printer_status | append [stats count | eval printer_status="DOWN OK WARNING UNKNOWN TESTING" | makemv printer_status | mvexpand printer_status] | chart max(count) as count by printer_status | eval ...
- Mark as New
- Bookmark Message
- Subscribe to Message
- Mute Message
- Subscribe to RSS Feed
- Permalink
- Report Inappropriate Content
I'm cool with that, marked it already.
Real time does cause some weirdness in some situations, yeah. If you're refreshing anyway then the value is small, and you can even set individual panels to refresh independently of the page.
- Mark as New
- Bookmark Message
- Subscribe to Message
- Mute Message
- Subscribe to RSS Feed
- Permalink
- Report Inappropriate Content
I just discovered something! Charts look OK when is not in real time.
rt-2m: https://flic.kr/p/pAzgNB
-120s: https://flic.kr/p/oWd7VH
So, I could live with that and have the chart to not be in real time ('cause I'm refreshing the whole dashboard page every 2mins anyway) and I'm happy to accept your solution. Are you cool with that?
- Mark as New
- Bookmark Message
- Subscribe to Message
- Mute Message
- Subscribe to RSS Feed
- Permalink
- Report Inappropriate Content
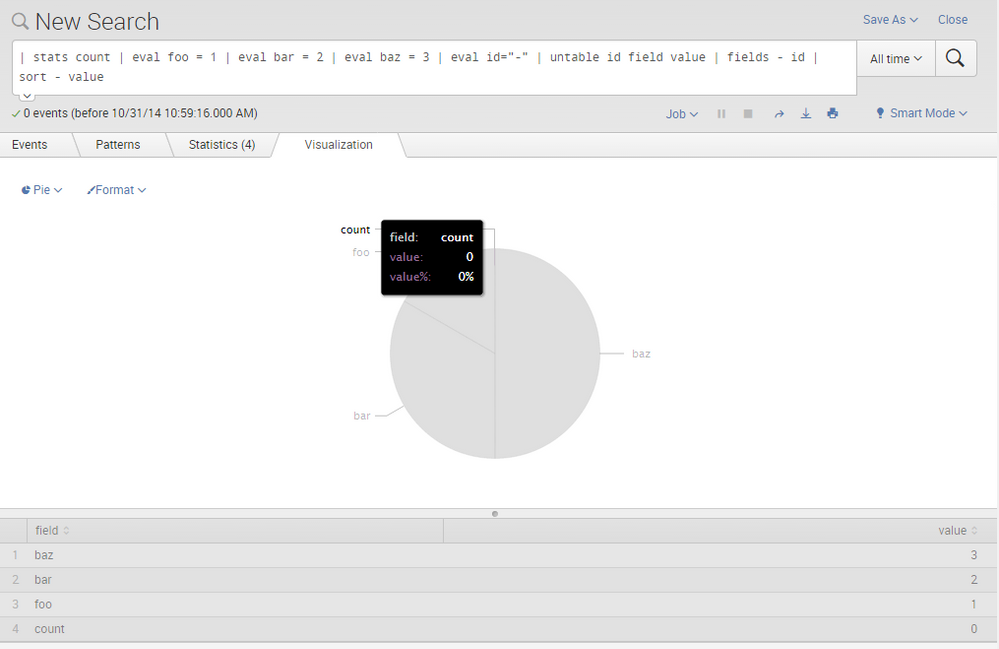
My zero field is called count, its value is the number 0 - you can see that in the overlay. The id="-" thing is just to create this dummy data.
Could you post the table that's underneath the pie chart?
- Mark as New
- Bookmark Message
- Subscribe to Message
- Mute Message
- Subscribe to RSS Feed
- Permalink
- Report Inappropriate Content
it is alfabetical indeed. So I rearranged it to https://flic.kr/p/pT4HQj and I think if the TESTING appeared as 0 that would solve my problem. Is it because there is no event TESTING at all in my index while you at least assigned a "-" value to it?
- Mark as New
- Bookmark Message
- Subscribe to Message
- Mute Message
- Subscribe to RSS Feed
- Permalink
- Report Inappropriate Content
- Mark as New
- Bookmark Message
- Subscribe to Message
- Mute Message
- Subscribe to RSS Feed
- Permalink
- Report Inappropriate Content
Cheers Martin, it's close but still not quite right as I have now (clockwise): DOWN (1) - red, OK (6) - green, UNKNOWN (1) - yellow, WARNING (14) - grey. So not in correct order 'cause I'd like a WARNING to be yellow and TESTING doesnt appear with 0. I'd post the screenshot but can't paste it here yet. Maybe here
https://flic.kr/p/pQNMsW
my full query is now
* "DOWN" OR "OK" OR "WARNING" OR "UNKNOWN" OR "TESTING" | rex "(?<printer_status>(DOWN|OK|WARNING|UNKNOWN|TESTING))" | chart count by printer_status | append [stats count | eval printer_status="DOWN OK WARNING UNKNOWN TESTING" | makemv printer_status | mvexpand printer_status] | chart max(count) as count by printer_status | eval foobar_slice = printer_status + " (" + count + ")" | fields foobar_slice, count

